
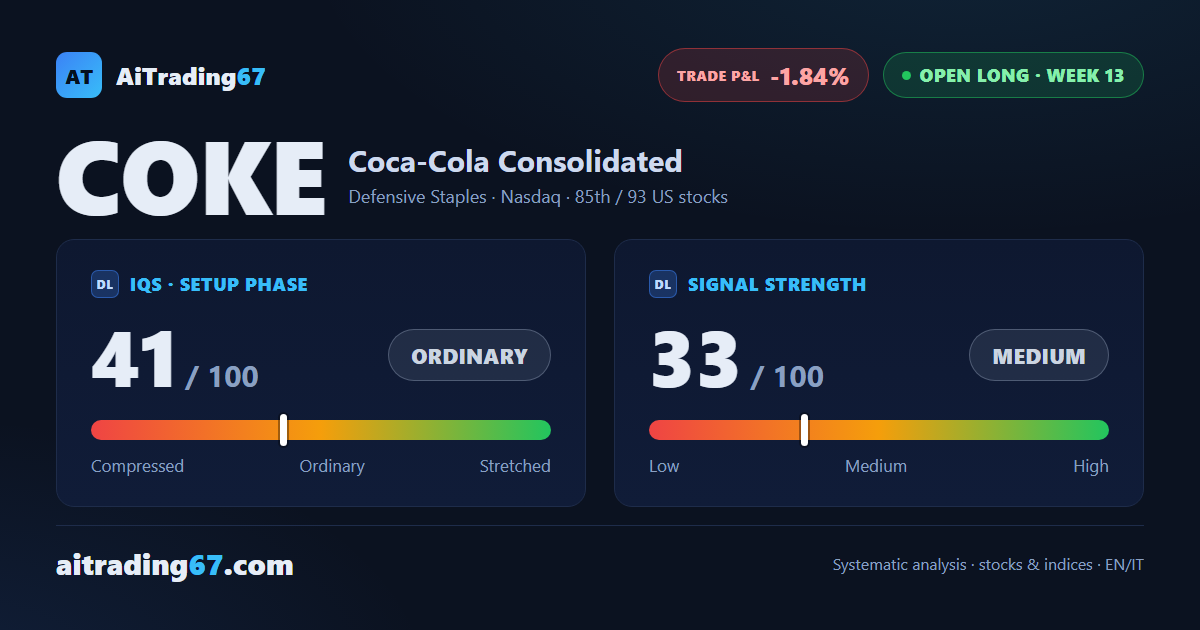
Open long · week 13
Coca-Cola Consolidated gains 0.9% as its sector slips, and the 20-week average holds
Our view last week
On the daily chart Coca-Cola Consolidated stock bounced off its 50-day average, in the 190 area, and over the week buyers came back to 54% of volume, after a week ruled by sellers. The recovery still stalls under the 20-day average, in the 192 area, and the week closes down 0.9%. In the weekly technical analysis the MACD below its Signal line and an ADX at 13 weigh in: the trend lacks direction, and for swing trading the key is a break of the 192 area.
This week's summary
Coca-Cola Consolidated closed up 0.9% in a week when its sector lost ground, after testing the 20-week moving average, in the 188 area, and closing above it. Compared with a week ago, Coca-Cola Consolidated stock has reclaimed its 20-day average, yet the daily chart still shows 3 lower highs, from the 202 area to the 195 area. In the weekly technical analysis the MACD stays below its Signal line and the ADX slips to 12.5: for swing trading on US stocks, the key is the 195 area, the 7-day high.
IQS Phase
41
ordinary
Signal Strength
33
medium · weak
Sizing
REDUCED
Ranking
#85 / 93
US stocks in progress
Trade P&L %
-1.84%
from signal to date, no stop loss
Coca-Cola Consolidated (COKE) weekly chart — EMA50 · MACD · VWAP
Weekly chart · EMA50 · MACD · VWAP · Source: TradingView
Rank position
ranks 85th among the 93 Longs already running for US stocks in our ranking, with a signal strength of 33 out of 100.
Sector context
SectorDefensive Staples
Benchmark ETFXLP
Sector regimeweak phase
Performanceweekly -1.86% · monthly -5.85%
COKE belongs to the defensive staples sector (reference ETF XLP). The sector is classified weak phase according to our weekly reading.
restricted Platinum content