
US communication services ETF · open buy, week 11
XLC drops 2.3% and slips back under its 50-week average as money flow stays negative
Our view last week
XLC, the US communication services ETF, gains 1.9% after last week's dip and lines up 4 higher lows on the daily chart, from the 110 area to the 112 area. The weekly MACD histogram is rising again, but the price action is unconvincing: sellers stay ahead in the weekly bar and money flow is still negative. In this XLC technical analysis the key is the 115 area, which has already turned the price back three times, with the buy signal 2.1% in profit.
This week's summary
XLC, the US communication services ETF, drops 2.3% and slips back below its 50-week average, which it had closed above only last week. In this XLC technical analysis the weight falls on money flow, negative for 3 weeks, and on a new 30-day low set during the week with no confirming close.
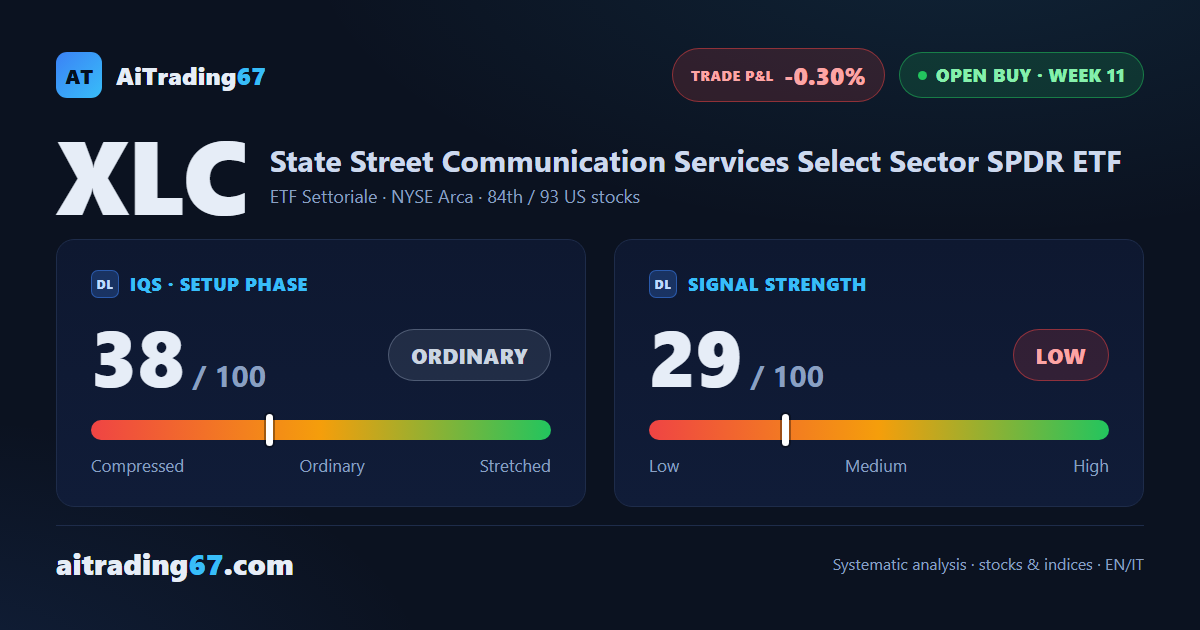
IQS Phase
38
ordinary
Signal Strength
29
low · fading
Sizing
MINIMUM
Ranking
#84 / 93
US stocks in progress
Trade P&L %
-0.30%
from signal to date, no stop loss
Communication Services US (XLC) weekly chart — EMA50 · MACD · VWAP
Weekly chart · EMA50 · MACD · VWAP · Source: TradingView
Rank position
ranks 84th among the 93 Longs already running for US stocks in our ranking, with a signal strength of 29 out of 100.
Sector context
SectorETF Settoriale
Benchmark ETFXLC
Sector regimein positive regime
Performanceweekly -2.34% · monthly -1.87%
XLC belongs to the etf settoriale sector (reference ETF XLC). The sector is classified in positive regime according to our weekly reading.
restricted Platinum content