
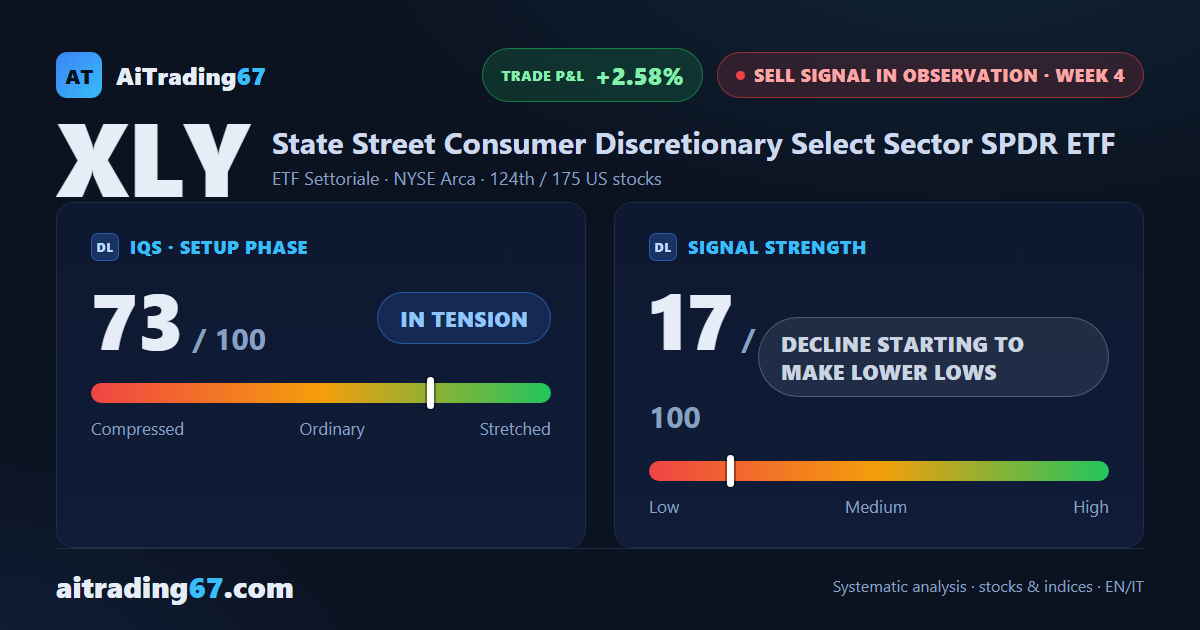
Sell signal in observation · week 4
XLY slips 0.5%: a new 90-day low that the weekly close did not confirm
Our view last week
For XLY, the US consumer discretionary ETF, this is a 7th straight losing week, and this time the stride shortens: just 0.4%, with no new lows and contracting volume. Sell signal strength collapses from 78 to 10, a decline losing steam. XLY technical analysis stays bearish on the weekly chart, and the price action pens the price between the 110.4 and 112.1 areas: for swing trading, this is a pause worth reading carefully.
This week's summary
XLY, the US consumer discretionary ETF, printed a new 90-day low in the 108 area that the weekly close did not confirm: the week ends down 0.5%, closing in the upper half of its range. It is the 8th straight weekly decline, after last week's shorter stride. In our XLY technical analysis the weekly picture stays bearish, with ADX rising, while weekly money flow turns positive after 11 weeks. For swing trading, the price action says wait: this trade setup keeps the sell signal under observation.
IQS Phase
73
in tension
Signal Strength
17
decline starting to make lower lows
Sizing
MINIMUM
Ranking
#124 / 175
US stocks sell signals
Trade P&L %
+2.58%
from signal to date, no stop loss
Consumer Discretionary US (XLY) weekly chart — EMA50 · MACD · VWAP
Weekly chart · EMA50 · MACD · VWAP · Source: TradingView
Rank position
ranks 124th among the 175 sell signals for US stocks in our ranking, with a signal strength of 17 out of 100.
Sector context
SectorETF Settoriale
Benchmark ETFXLY
Sector regimeweak phase
Performanceweekly -0.47% · monthly -4.20%
XLY belongs to the etf settoriale sector (reference ETF XLY). The sector is classified weak phase according to our weekly reading.
restricted Platinum content