
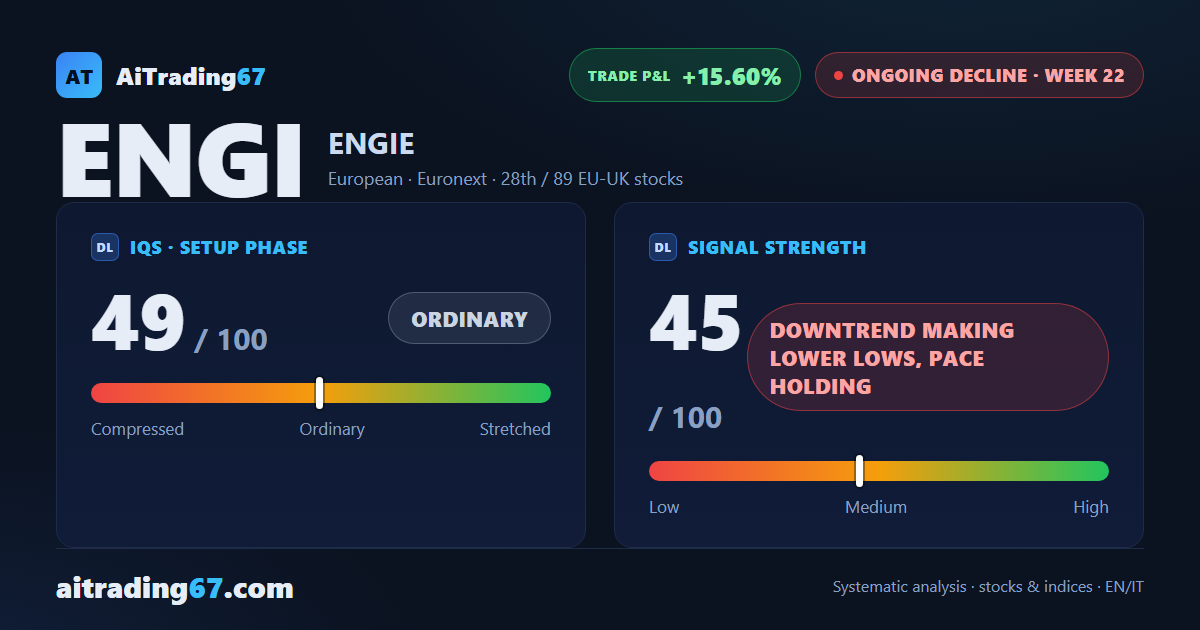
Ongoing decline · week 22 · short up 15.6%
ENGIE slips 2.4% to a fresh 30-week low, right on its 100-week moving average
Our view last week
ENGIE's bounce faded after a single week: the stock slipped 2.8% and sellers took 81% of weekly volume, against a 69% buy share 7 days earlier. ENGIE stock is back near its recent lows, below the 50-week average, with the weekly RSI at 35 and money flow negative for 6 weeks. The price action stays bearish and the decline is picking up its stride, with the short 13.5% in profit since entry, a swing trading case to follow week by week.
This week's summary
ENGIE stock sheds another 2.4% and sets a fresh 30-week low, confirmed by the weekly close, right where the 100-week moving average runs, in the 22.3 area. A week ago the bounce had just faded; now the decline resumes, with 6 lower highs on the daily chart, the weekly ADX rising for 5 weeks and money flow negative for 7. Technical analysis still reads a bearish price action, and the short is now 15.6% in profit since entry: a swing trading case to follow week by week.
IQS Phase
49
ordinary
Signal Strength
45
downtrend making lower lows, pace holding
Sizing
REDUCED
Ranking
#28 / 89
EU-UK stocks
Trade P&L %
+15.60%
from signal to date, no stop loss
ENGIE (ENGI) weekly chart — EMA50 · MACD · VWAP
Weekly chart · EMA50 · MACD · VWAP · Source: TradingView
Rank position
ranks 28th among the 89 sell signals for European-UK stocks in our ranking, with a signal strength of 45 out of 100.
Sector context
SectorEuropean
Benchmark ETFEXH9
Sector regimein positive regime
Performanceweekly +0.55% · monthly +1.10%
ENGI belongs to the european sector (reference ETF EXH9). The sector is classified in positive regime according to our weekly reading.
restricted Platinum content