
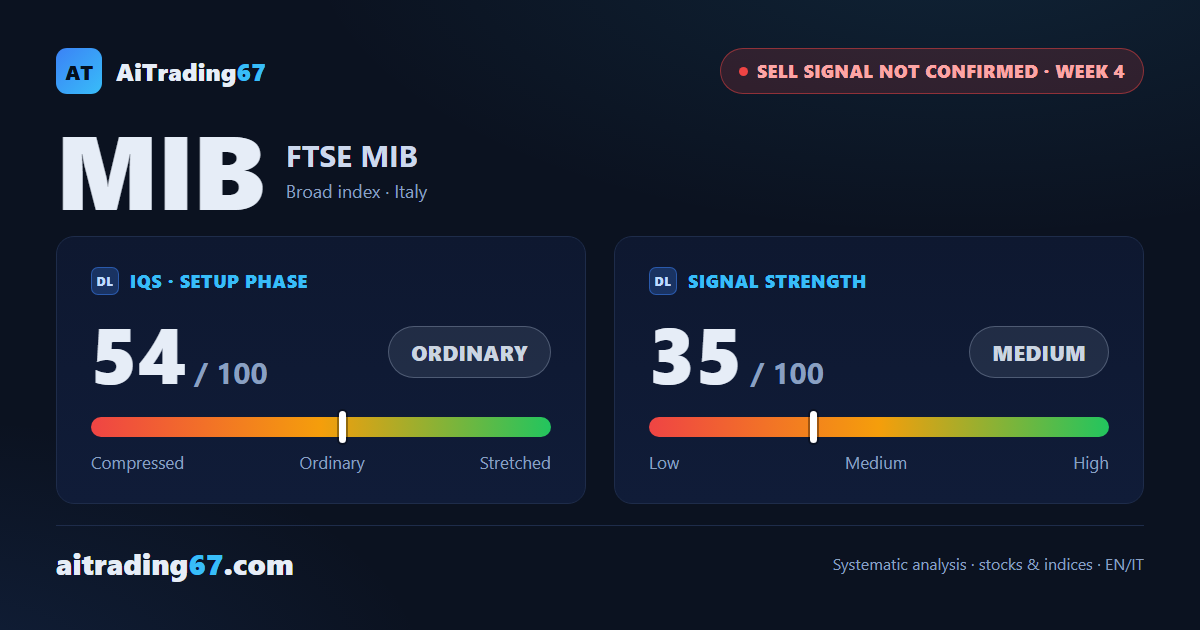
FTSE MIB · sell signal week 4, the corridor gives way
MIB (FTSE MIB): the corridor gives way, new 30-session low and 20-week average lost
Our view last week
The MIB, the FTSE MIB ETF, completes the 3-week check on its sell signal without the 6% drop that would have confirmed it: a week ago it stood 1.18% below the signal, and it has since clawed back part of that ground. The corridor is narrowing, with the recent low in the 52.7 area holding and the daily averages in the 53.3 area turning back every bounce. Technical analysis shows fading momentum and bearish price action: while price stays in this band, patience pays.
This week's summary
The MIB, the FTSE MIB ETF, drops out of the bottom of the corridor it was trading in a week ago: the low that had been holding gave way, price printed a new 30-session low in the 51.1 area and lost its 20-week average. Performance since the sell signal slips to -3.38%, after a review that closed without the 6% drop that would have confirmed it. Technical analysis shows momentum still fading and bearish price action, yet the first supports are close: a new trade setup is worth waiting for.
Sell signal not confirmed
·review closed on 25 September
·EU-UK Broad indices
·T1
★ See Gold version →
IQS Phase
54
ordinary
Signal Strength
35
medium · weak
ATH distance
7.47%
7.47%
KPI 4
0/3
FTSE MIB weekly chart — EMA50 · MACD · VWAP
Weekly chart · EMA50 · MACD · VWAP · Source: TradingView
restricted Platinum content