
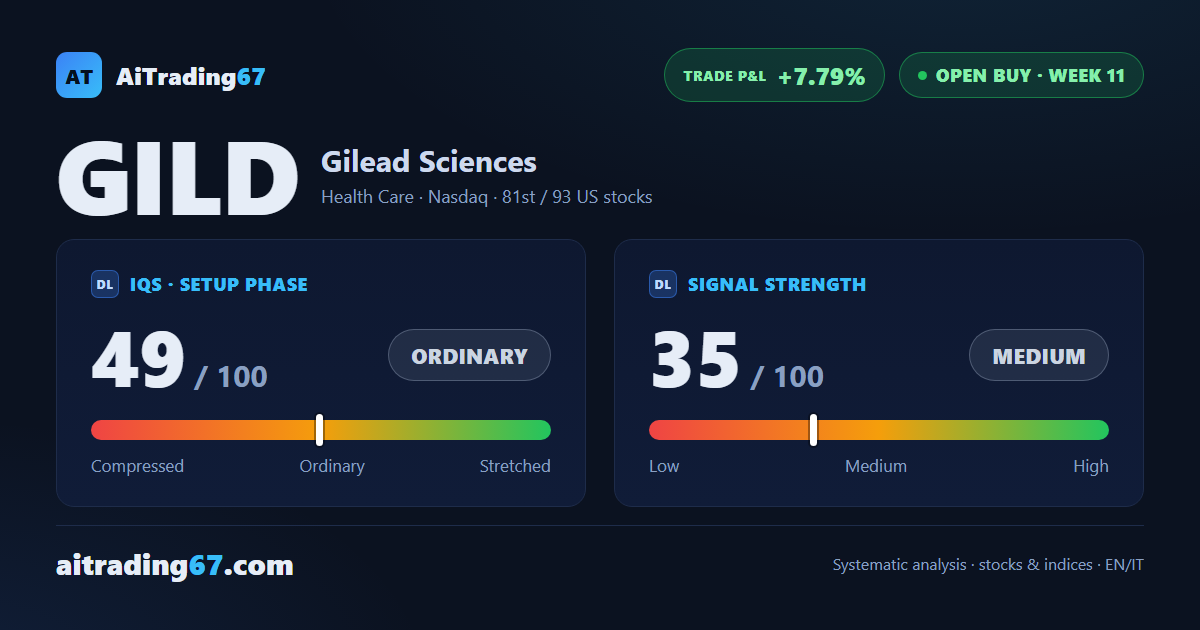
US stocks · open buy, week 11
Gilead drops 4.1% and stops at its 50-day average, with earnings coming into view
Our view last week
After last week's 4.4% jump, Gilead stock slows down: +0.5% on the week, holding just over 4% below its all-time high, after 3 tests of its recent highs. The weekly bar is losing body and sellers had the upper hand in the week's volume, while ADX has been rising for 8 weeks. For swing trading, this technical analysis favours entries only on pullbacks; among US stocks with weekly buy signals, this one is 12.4% in profit since entry.
This week's summary
Gilead gives back 4.1% after 2 weeks of gains and leans on its 50-day moving average, touched during the week and held at the close. A week ago it was stalling just over 4% below its all-time high; it now sits 8% under it. Technical analysis of Gilead stock stays constructive on the weekly chart, with aligned averages and ADX rising for 9 weeks, but the MACD histogram has turned down. Among US stocks with weekly buy signals it is still 7.8% in profit; for swing trading, the 144 area must hold.
IQS Phase
49
ordinary
Signal Strength
35
medium · weak
Sizing
REDUCED
Ranking
#81 / 93
US stocks in progress
Trade P&L %
+7.79%
from signal to date, no stop loss
Gilead Sciences (GILD) weekly chart — EMA50 · MACD · VWAP
Weekly chart · EMA50 · MACD · VWAP · Source: TradingView
Rank position
ranks 81st among the 93 Longs already running for US stocks in our ranking, with a signal strength of 35 out of 100.
Sector context
SectorHealth Care
Benchmark ETFXLV
Sector regimein positive regime
Performanceweekly -2.65% · monthly -3.91%
GILD belongs to the health care sector (reference ETF XLV). The sector is classified in positive regime according to our weekly reading.
restricted Platinum content