
Sell signal · week 8
GSK drops 3.9% and slides back to its September lows as money flow weakens
Our view last week
A week after its 6% rebound, GSK stock is giving ground again: down 1.4% on the week, with 100% of volume on the sell side. The weekly technical analysis shows price action in a strong distribution phase and money flow below zero for a 4th straight week. Yet price is still inside the Ichimoku cloud and the ADX keeps sliding: the Sell signal carries on without a clear direction, and the short is 1.8% in the red.
This week's summary
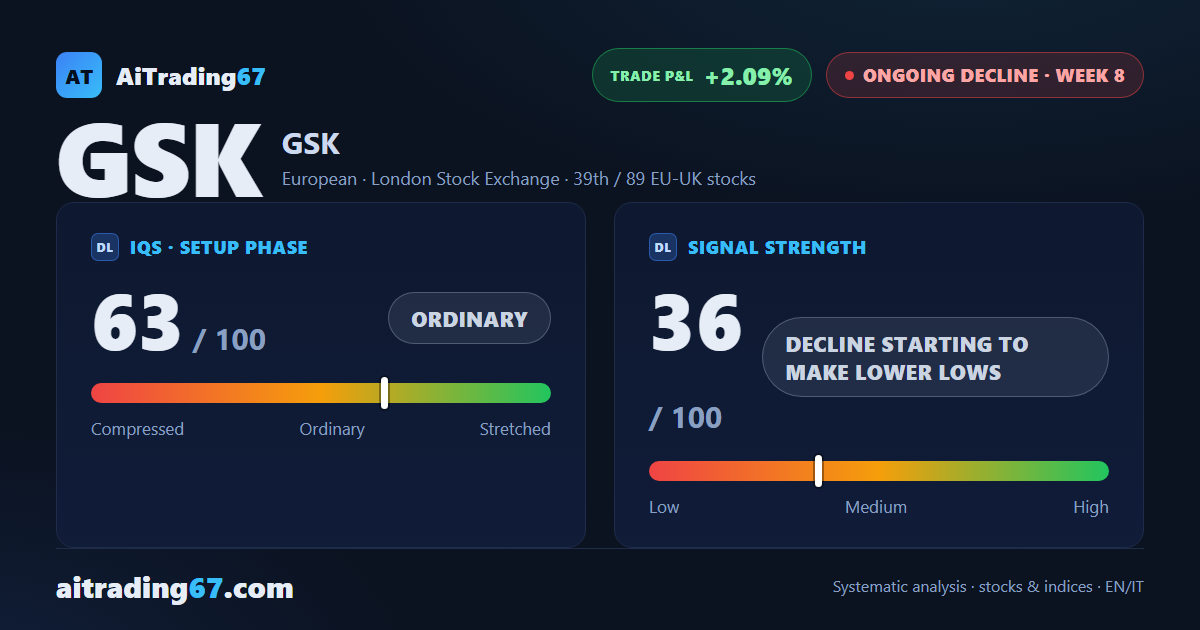
Turned away at the 50-week moving average, GSK stock drops 3.9% and slides back to its September lows, in the 1790 area, which no session has defended yet. The weekly technical analysis is weaker than 7 days ago: money flow hits its lowest reading in 4 weeks and the MACD histogram turns down again. The ADX is stuck at 13, though, and price action describes a decline with no firm trend. The Sell signal's short, in the red a week ago, is back to a 2.1% gain.
IQS Phase
63
ordinary
Signal Strength
36
decline starting to make lower lows
Sizing
REDUCED
Ranking
#39 / 89
EU-UK stocks
Trade P&L %
+2.09%
from signal to date, no stop loss
Rank position
ranks 39th among the 89 sell signals for European-UK stocks in our ranking, with a signal strength of 36 out of 100.
Sector context
SectorEuropean
Benchmark ETFEXV4
Sector regimeweak phase
Performanceweekly -2.52% · monthly -5.64%
GSK belongs to the european sector (reference ETF EXV4). The sector is classified weak phase according to our weekly reading.
restricted Platinum content