
US stocks · Ongoing decline, week 5
Home Depot sheds 3.5% and sets a new 90-week low as the slide stretches on
Our view last week
Home Depot posts a 7th straight weekly loss, down 2.3%, and the daily chart lines up 4 lower highs from the 322 area to the 306 area. Sellers dominate the weekly bar to an extreme and money flow stays in distribution. Technical analysis of Home Depot stock confirms bearish price action among US stocks: signal strength climbs to 97 out of 100, a downtrend making lower lows at a steady pace, with the short 8.7% in profit.
This week's summary
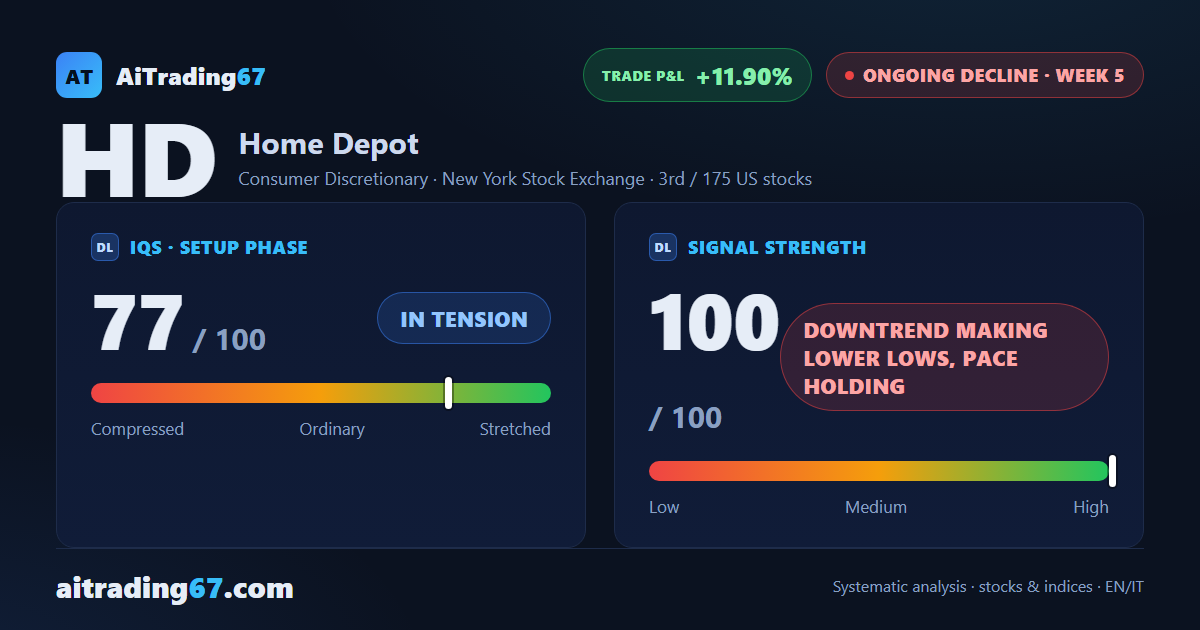
Home Depot loses another 3.5% and, in its 8th straight weekly decline, sets a new 90-week low in the 277 area, confirmed by the weekly close. A week ago the stock had closed near the week's low; this time it finishes a little higher in its range, while the daily RSI drops to 26, into oversold territory. Technical analysis of Home Depot stock still points down among US stocks: ADX rising, money flow in distribution and the short now 11.9% in profit.
IQS Phase
77
in tension
Signal Strength
100
downtrend making lower lows, pace holding
Sizing
STANDARD
Ranking
#3 / 175
US stocks
Trade P&L %
+11.90%
from signal to date, no stop loss
Home Depot (HD) weekly chart — EMA50 · MACD · VWAP
Weekly chart · EMA50 · MACD · VWAP · Source: TradingView
Rank position
ranks 3rd among the 175 sell signals for US stocks in our ranking, with a signal strength of 100 out of 100.
Sector context
SectorConsumer Discretionary
Benchmark ETFXLY
Sector regimeweak phase
Performanceweekly -0.47% · monthly -4.20%
HD belongs to the consumer discretionary sector (reference ETF XLY). The sector is classified weak phase according to our weekly reading.
restricted Platinum content