
US small caps · week 16 of the buy signal
IWM (Russell 2000): MACD slips below zero as daily highs step down
US small caps · week 16 of the buy signal
Our view last week
Weekly technical analysis of the IWM, an ETF tracking the Russell 2000, finds US small caps less than 4% below their all-time high, in profit since entry but with the drive cooling. Strength stays spread across a broad basket — healthcare, industrials, banks and technology nearly level, with no single engine. The MACD histogram has fallen for a month, price action has turned lower and buyers are losing ground. The structure holds, but the cycle is well along: caution on fresh entries.
This week's summary
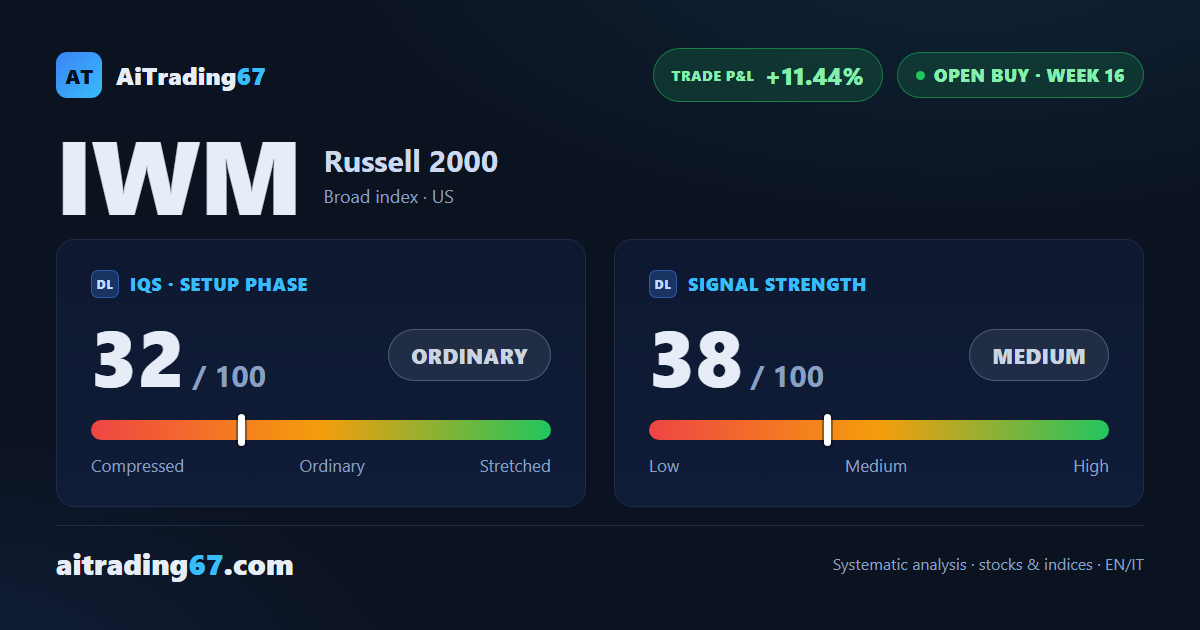
The MACD on the IWM, the Russell 2000 ETF, has slipped below zero: weekly technical analysis of US small caps records a first bearish crossover after a month of a fading histogram. Price still holds within 4% of its record and is up 11.44% since entry, yet daily highs have stepped down for four sessions and the all-time high already turned the run back in mid-July.
IQS Phase
32
ordinary
Signal Strength
38
medium · weak
ATH distance
3.96%
3.96%
KPI 4
0/3
Trade P&L %
+11.44%
from signal to date, no stop loss
restricted Platinum content