
US small caps back at the record
IWM (Russell 2000): the all-time high within reach, a mature uptrend
US small caps back at the record
Our view last week
The MACD on the IWM, the Russell 2000 ETF, has slipped below zero: weekly technical analysis of US small caps records a first bearish crossover after a month of a fading histogram. Price still holds within 4% of its record and is up 11.44% since entry, yet daily highs have stepped down for four sessions and the all-time high already turned the run back in mid-July.
This week's summary
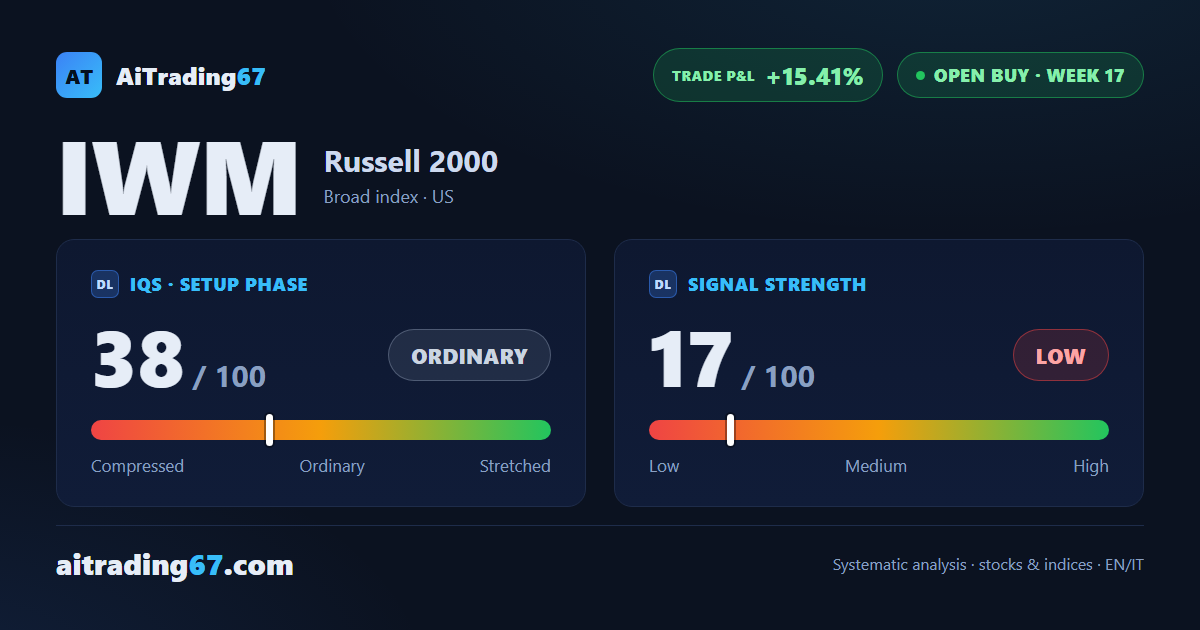
The IWM, the Russell 2000 ETF, is knocking on its all-time high again: two touches within days and price now half a percent from the record, with the gain since the buy signal up to 15.41%. Weekly technical analysis of US small caps marks a turn versus seven days ago — the MACD histogram has stopped sinking and is climbing back, still below zero, while on the daily buying accounts for nearly 80% of turnover. Only the record stands ahead.
IQS Phase
38
ordinary
Signal Strength
17
low · fading
ATH distance
0.50%
0.50%
KPI 4
0/3
Trade P&L %
+15.41%
from signal to date, no stop loss
restricted Platinum content