
US Stocks — Sell Signal Under Watch
JD.com Slips Below the 50-Week Average and Confirms the Sell Signal
Our view last week
JD.com tries to break through the 33 area and gets rejected: the week closes down 11.9%, with sellers extremely dominant in the last bar. The breakdown lands right ahead of earnings, and the stock flips into a fresh sell signal, with the weekly structure sliding below the 50-week average.
This week's summary
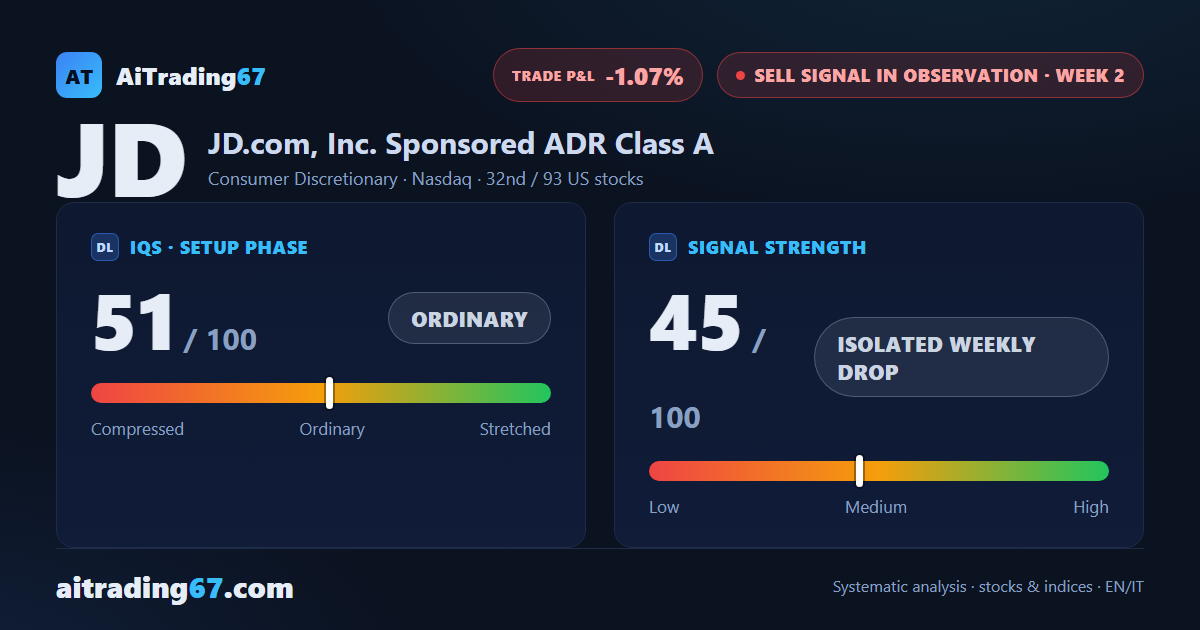
JD.com remains in the sell signal that opened last week, when the stock broke below its 50-week moving average with an 11.9% drop right ahead of earnings. This week price is attempting a modest rebound, but buyer dominance is already fading and the technical picture stays ordinary. Our model flags elevated risk and advises against opening: confirmation of the signal is still underway.
IQS Phase
51
ordinary
Signal Strength
45
isolated weekly drop
Sizing
REDUCED
Ranking
#32 / 93
US stocks sell signals
Trade P&L %
-1.07%
from signal to date, no stop loss
Rank position
ranks 32nd among the 93 sell signals for US stocks in our ranking, with a signal strength of 45 out of 100.
Sector context
SectorConsumer Discretionary
Benchmark ETFXLY
Sector regimein strong phase
Performanceweekly -0.15% · monthly +3.51%
JD belongs to the consumer discretionary sector (reference ETF XLY). The sector is classified in strong phase according to our weekly reading.
restricted Platinum content