
Sell signal, week 2 · US stocks
JPMorgan slides 3.1% to a fresh 30-day low, with the 200-day average within reach
Our view last week
JPMorgan's weekly MACD has dropped below its Signal line after 16 weeks, and a fresh sell signal fires on JPMorgan stock. The week lost 1.9%, a third straight decline, with sellers back in front in the weekly bar. On the daily chart JPMorgan has printed 4 lower highs, from the 363 area down to the 354 area. The technical analysis still calls for caution: the stock holds above its 50-week moving average.
This week's summary
A 4th straight weekly decline for JPMorgan: the stock drops 3.1%, prints a fresh 30-day low and loses its 20-week average. A week ago the Sell signal had only just fired; now the decline is keeping its pace, with the 200-day average in the 325 area as the next test. The technical analysis still argues for caution on fresh shorts: JPMorgan stock holds above its 50-week average, the trade setup is rated high-risk, and earnings land on October 13.
Sell signal in observation
·2nd week from start
·US stocks
·T2
·📅 Earnings · Oct 13
★ See Gold version →
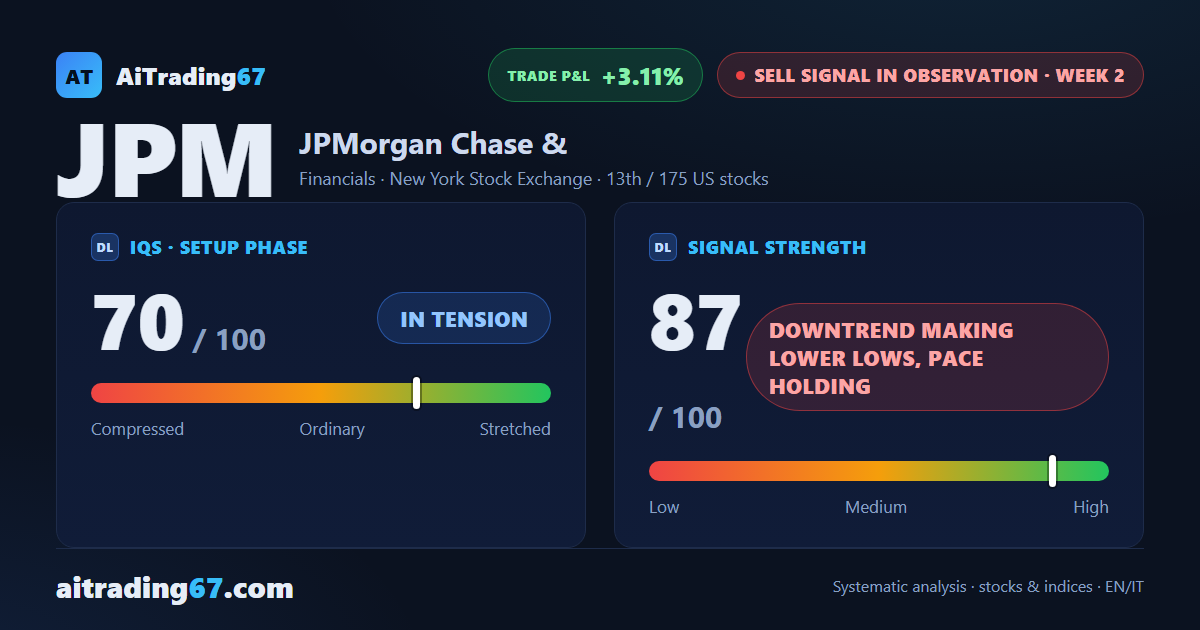
IQS Phase
70
in tension
Signal Strength
87
downtrend making lower lows, pace holding
Sizing
STANDARD
Ranking
#13 / 175
US stocks sell signals
Trade P&L %
+3.11%
from signal to date, no stop loss
JPMorgan Chase (JPM) weekly chart — EMA50 · MACD · VWAP
Weekly chart · EMA50 · MACD · VWAP · Source: TradingView
Rank position
ranks 13th among the 175 sell signals for US stocks in our ranking, with a signal strength of 87 out of 100.
Sector context
SectorFinancials
Benchmark ETFXLF
Sector regimeweak phase
Performanceweekly -2.46% · monthly -7.23%
JPM belongs to the financials sector (reference ETF XLF). The sector is classified weak phase according to our weekly reading.
restricted Platinum content