
Sell signal under observation · week 3
Klabin slips 1.6% as the rebound fades under its long-term averages
Our view last week
After the 7.3% drop that triggered the Sell signal, Klabin bounced 3.1% off its 50-day moving average and weekly money flow moved back above zero. On our technical analysis the decline is still an isolated weekly drop with no follow-through: Klabin stock is pinned between its 7-day high and a cluster of moving averages, and this trade setup, first among the 9 Rest of the World sell signals, is still waiting for confirmation. Our model rates opening a short here as high-risk.
This week's summary
Klabin's rebound lasted one week: the stock slipped 1.6%, stalled beneath its 100- and 200-week moving averages and fell back under the cluster of averages it had closed above a week earlier. Weekly money flow is negative again too. On our technical analysis Klabin stock stays in a Sell signal still waiting for confirmation, with price action showing distribution: the trade setup is there, and our model rates opening a short here as high-risk.
Sell signal in observation
·3rd week from start
·Rest of the World stocks
·T2
·📅 Earnings · Oct 28
★ See Gold version →
IQS Phase
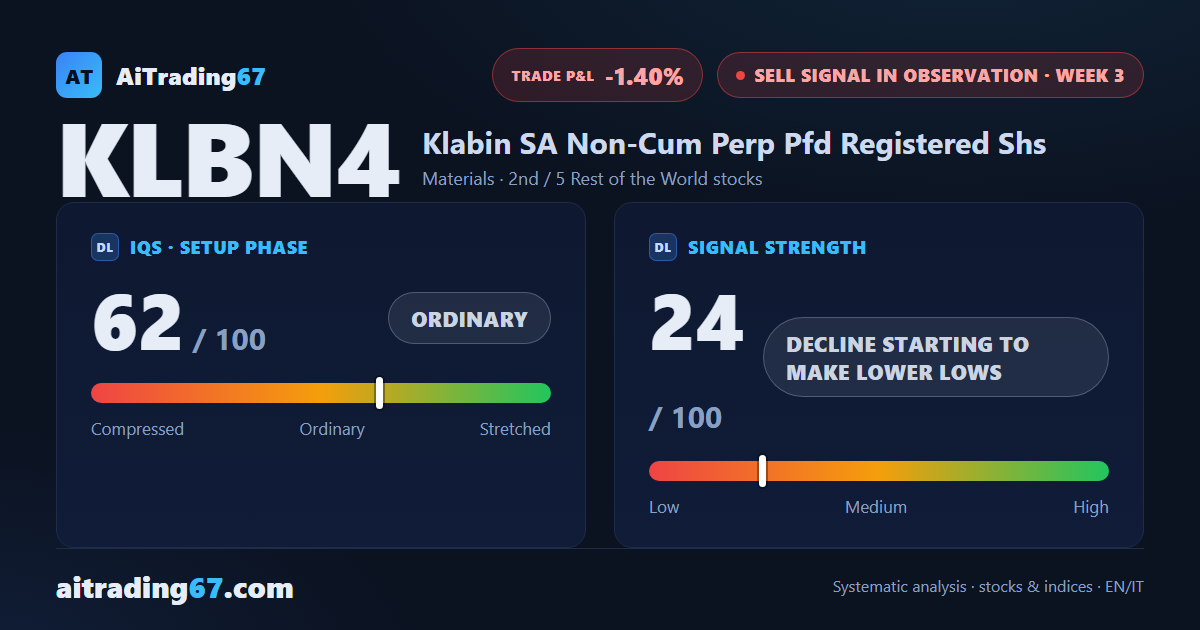
62
ordinary
Signal Strength
24
decline starting to make lower lows
Sizing
MINIMUM
Ranking
#2 / 5
Rest of the World stocks sell signals
Trade P&L %
-1.40%
from signal to date, no stop loss
Klabin (KLBN4) weekly chart — EMA50 · MACD · VWAP
Weekly chart · EMA50 · MACD · VWAP · Source: TradingView
Rank position
ranks 2nd among the 5 sell signals for titoli resto del mondo in our ranking, with a signal strength of 24 out of 100.
Sector context
SectorMaterials
Benchmark ETFXLB
Sector regimeweak phase
Performanceweekly +1.17% · monthly -3.81%
KLBN4 belongs to the materials sector (reference ETF XLB). The sector is classified weak phase according to our weekly reading.
restricted Platinum content