
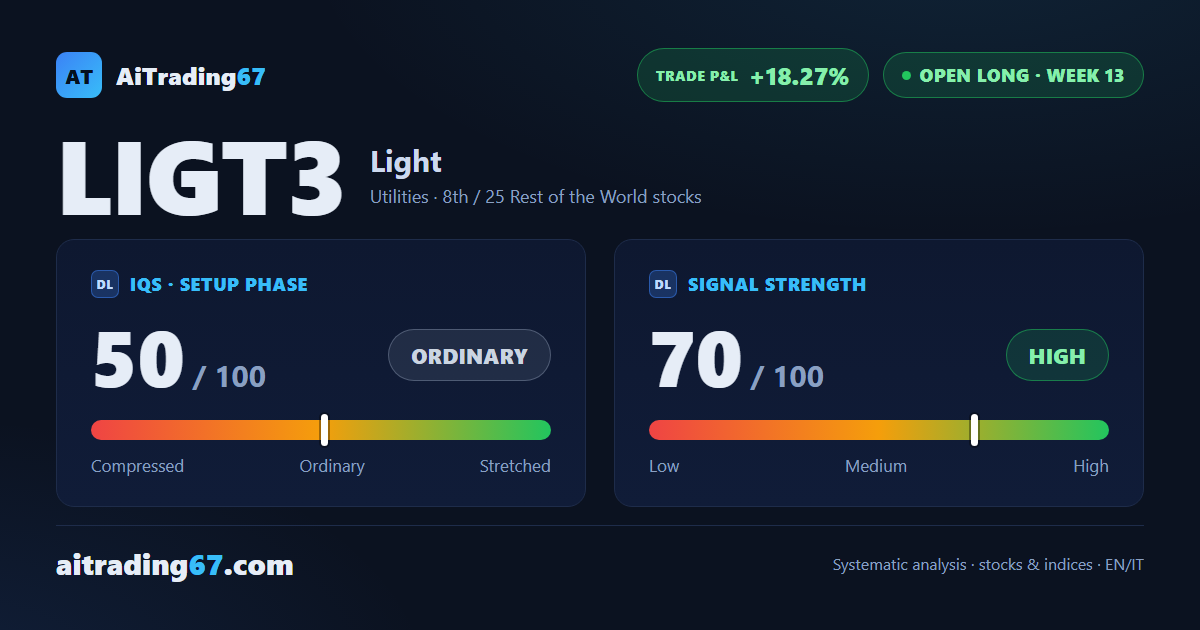
Light stock · trade up 18% since entry
Light slips 3% as the 200-day average turns the rally back again
Our view last week
The new 90-day high that the weekly close failed to confirm a week ago now holds: Light gains 4.5%, reaches the 4.15 area and closes above the old high. Yet Light stock ends the week in the lower part of its range, turned back by the 200-day average in the 3.95 area and by the 50-week average. The weekly technical analysis is improving, MACD rising and money flow positive, and among weekly buy signals on utility stocks this trade is up 22% since entry.
This week's summary
Light stock gives back 3% after two up weeks: the 200-day average in the 3.94 area and the 50-week average turn the price back again. On the daily chart the price action shows a 4% bounce off the 20-day average, and money flow stays positive. The weekly technical analysis sees a rally that holds and slows; among weekly buy signals on utility stocks, this trade is up 18% since entry.
Open long
·13th week from start
·Rest of the World stocks
·T1
·📅 Earnings · Nov 12
★ See Gold version →
IQS Phase
50
ordinary
Signal Strength
70
high · wide & volatile
Sizing
FULL
Ranking
#8 / 25
Rest of the World stocks in progress
Trade P&L %
+18.27%
from signal to date, no stop loss
Light (LIGT3) weekly chart — EMA50 · MACD · VWAP
Weekly chart · EMA50 · MACD · VWAP · Source: TradingView
Rank position
ranks 8th among the 25 Longs already running for titoli resto del mondo in our ranking, with a signal strength of 70 out of 100.
Sector context
SectorUtilities
Benchmark ETFXLU
Sector regimein positive regime
Performanceweekly +1.93% · monthly +2.15%
LIGT3 belongs to the utilities sector (reference ETF XLU). The sector is classified in positive regime according to our weekly reading.
restricted Platinum content