
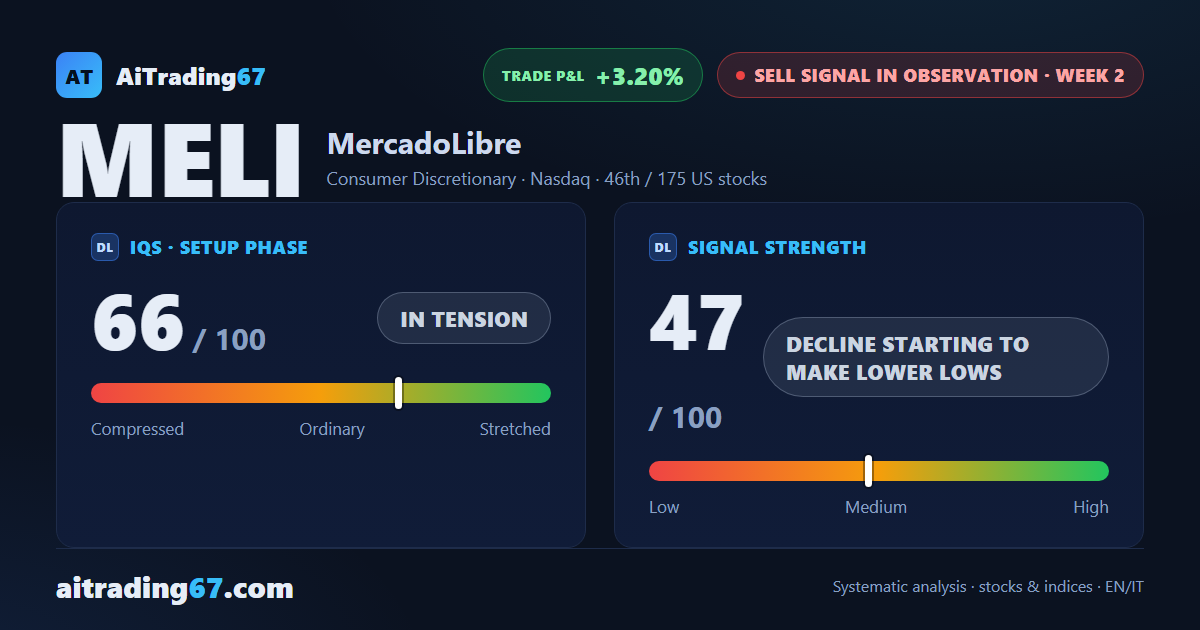
Sell signal, week 2 · US stocks
MercadoLibre drops 3.2% and loses its 200-week average as the weekly MACD turns lower
Our view last week
On the daily chart MercadoLibre has printed 3 lower highs since September 3, from the 2070 area to the 1840 area, and the week closed down 1.9%. A new sell signal now kicks in on MercadoLibre stock, a week after price broke below the stops of the previous buy trade. Technical analysis shows sellers ahead and strong distribution among these US stocks to watch, yet the decline lacks fresh push and price rests on the 200-week average.
This week's summary
MercadoLibre has lost the 200-week average it was resting on a week ago: the week closed down 3.2%, its 4th straight decline, and the weekly MACD slipped below its Signal line after 15 weeks. MercadoLibre stock also set a new 30-day low, in the 1670 area, and the sell signal is gathering pace: our technical analysis reads a decline starting to make lower lows. Elevated volatility and lower highs in daily price action keep it among the US stocks to watch, with new entries not recommended.
IQS Phase
66
in tension
Signal Strength
47
decline starting to make lower lows
Sizing
REDUCED
Ranking
#46 / 175
US stocks sell signals
Trade P&L %
+3.20%
from signal to date, no stop loss
MercadoLibre (MELI) weekly chart — EMA50 · MACD · VWAP
Weekly chart · EMA50 · MACD · VWAP · Source: TradingView
Rank position
ranks 46th among the 175 sell signals for US stocks in our ranking, with a signal strength of 47 out of 100.
Sector context
SectorConsumer Discretionary
Benchmark ETFXLY
Sector regimeweak phase
Performanceweekly -0.47% · monthly -4.20%
MELI belongs to the consumer discretionary sector (reference ETF XLY). The sector is classified weak phase according to our weekly reading.
restricted Platinum content