
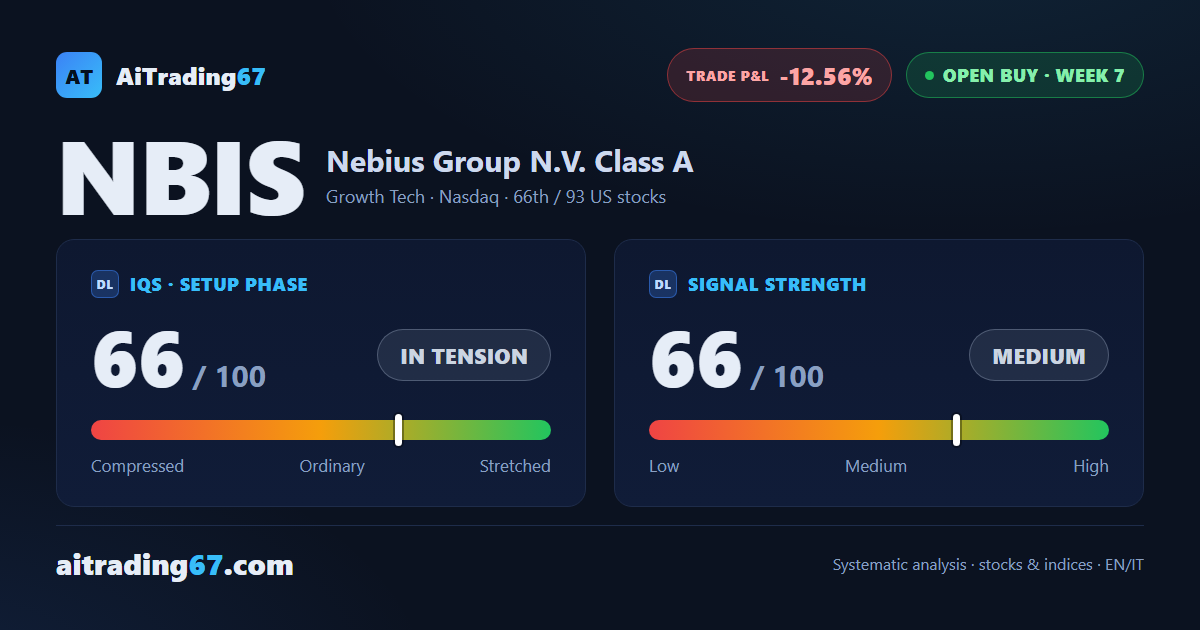
Open buy · week 7 · US stocks
Nebius gains 2.3% and prints a new 7-session high the weekly close fails to confirm
Our view last week
Weekly money flow is back above zero after 5 negative weeks, and the week closes up 6.2%, after a prior week that ended slightly lower despite its bounce. On the daily chart, price action draws three higher lows, from the 195 area to the 226 area. Nebius stock still sits below its 7-session high in the 249 area: technical analysis of this buy signal, among US tech stocks, needs that break before calling a restart.
This week's summary
Nebius closes the week up 2.3% and prints a new 7-session high, in the 250 area, without confirming it at the close: the break that technical analysis was asking for last week is still to come. Underneath, the daily chart stretches its run of higher lows to 4, from the 204 area to the 228 area, and weekly money flow is positive for a 2nd week. Among tech stocks with weekly buy signals, Nebius stock stays on hold, with earnings on October 22 drawing closer.
IQS Phase
66
in tension
Signal Strength
66
medium
Sizing
STANDARD
Ranking
#66 / 93
US stocks in progress
Trade P&L %
-12.56%
from signal to date, no stop loss
Nebius (NBIS) weekly chart — EMA50 · MACD · VWAP
Weekly chart · EMA50 · MACD · VWAP · Source: TradingView
Rank position
ranks 66th among the 93 Longs already running for US stocks in our ranking, with a signal strength of 66 out of 100.
Sector context
SectorGrowth Tech
Benchmark ETFXLK
Sector regimein strong phase
Performanceweekly +1.80% · monthly +8.83%
NBIS belongs to the growth tech sector (reference ETF XLK). The sector is classified in strong phase according to our weekly reading.
restricted Platinum content