
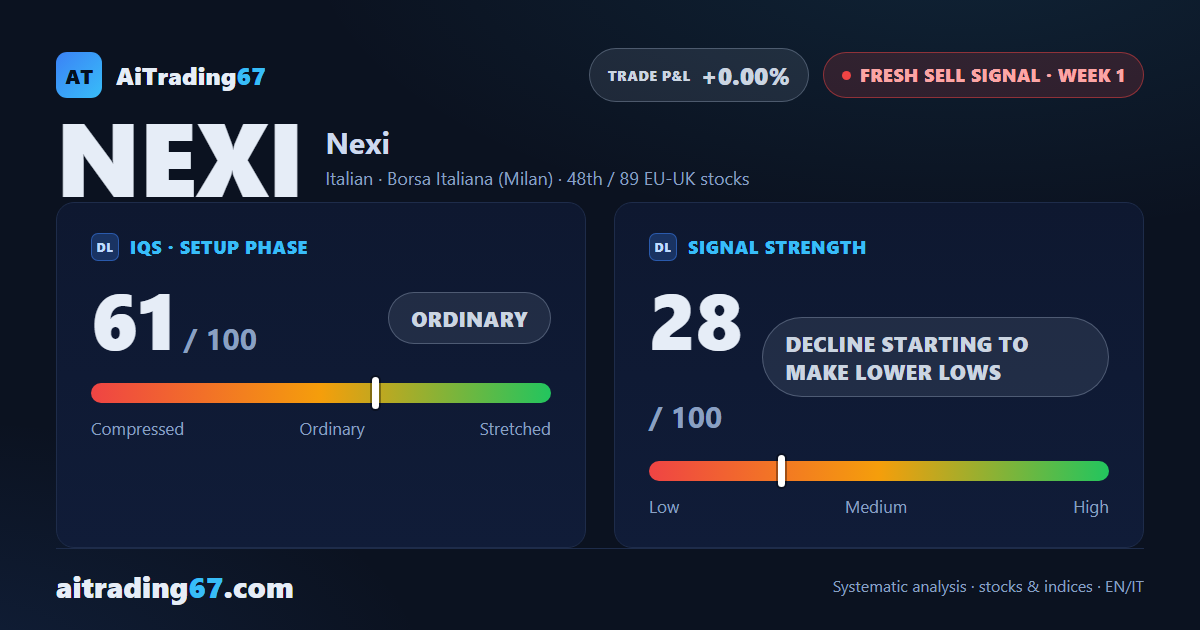
New sell signal · week 1
Nexi drops 2.9% and snaps its run of higher lows as a new Sell signal fires
Our view last week
After 3 losing weeks, Nexi stock is up 0.5% and the daily chart shows 3 higher lows, from the 4.05 area to the 4.1 area. Last week the highs were falling, now the lows are rising: the price is getting squeezed. Trading volume is still in sellers' hands, though, and money flow has been below zero for 2 weeks. Technical analysis shows a buy signal still 5.65% in profit, with price action coiling as it waits for a direction.
This week's summary
The run of higher lows Nexi had built on the daily chart since mid-September broke on Oct 1, when a close fell below the last low in the 4.1 area. Nexi stock lost 2.9% on the week, slipped back under its 50-week moving average and a new Sell signal fired. Last week price was coiling, waiting for a direction: technical analysis now points it lower, with money flow negative for 3 weeks and price action in a distribution phase.
IQS Phase
61
ordinary
Signal Strength
28
decline starting to make lower lows
Sizing
MINIMUM
Ranking
#48 / 89
New eu-uk stocks
Trade P&L %
+0.00%
from signal to date, no stop loss
Rank position
ranks 48th among the 89 sell signals for European-UK stocks in our ranking, with a signal strength of 28 out of 100.
Sector context
SectorItalian
Benchmark ETFEXV1
Sector regimeweak phase
Performanceweekly -4.91% · monthly -4.92%
NEXI belongs to the italian sector (reference ETF EXV1). The sector is classified weak phase according to our weekly reading.
restricted Platinum content