
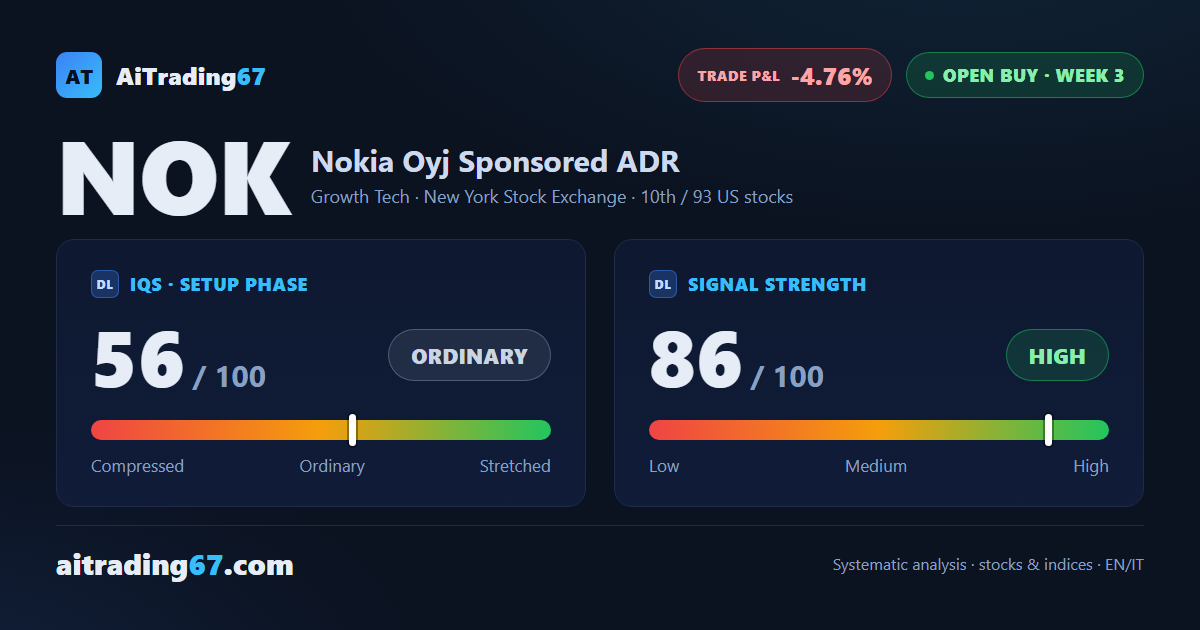
Open buy · week 3
Nokia regains 2%, but the 20-week average turns it away once more
Our view last week
Sellers are back in charge of Nokia stock: they dominated the weekly bar to an extreme degree after 3 weeks led by buyers, and the stock gave up another 2.7%. The price slips below the band of moving averages between the 10.4 and 10.7 area, which turned the price away again. Money flow, meanwhile, is still positive. Technical analysis of one of this week's weekly buy signals in tech stocks, now under pressure and already carrying an early-exit warning.
This week's summary
Nokia bounced 5% off its 20-day moving average and closed the week up 2%, after 2 straight declines. The recovery stalls where it stalled a week ago, though: the 20-week average, in the 10.7 area, turns the price away again. Nokia stock stays below its entry level, with weekly money flow positive and the MACD still under its Signal line. Technical analysis and price action of a buy signal in week 3, still carrying an early-exit warning.
IQS Phase
56
ordinary
Signal Strength
86
high · wide & volatile
Sizing
FULL
Ranking
#10 / 93
US stocks in progress
Trade P&L %
-4.76%
from signal to date, no stop loss
Nokia (NOK) weekly chart — EMA50 · MACD · VWAP
Weekly chart · EMA50 · MACD · VWAP · Source: TradingView
Rank position
ranks 10th among the 93 Longs already running for US stocks in our ranking, with a signal strength of 86 out of 100.
Sector context
SectorGrowth Tech
Benchmark ETFXLK
Sector regimein strong phase
Performanceweekly +1.80% · monthly +8.83%
NOK belongs to the growth tech sector (reference ETF XLK). The sector is classified in strong phase according to our weekly reading.
restricted Platinum content