
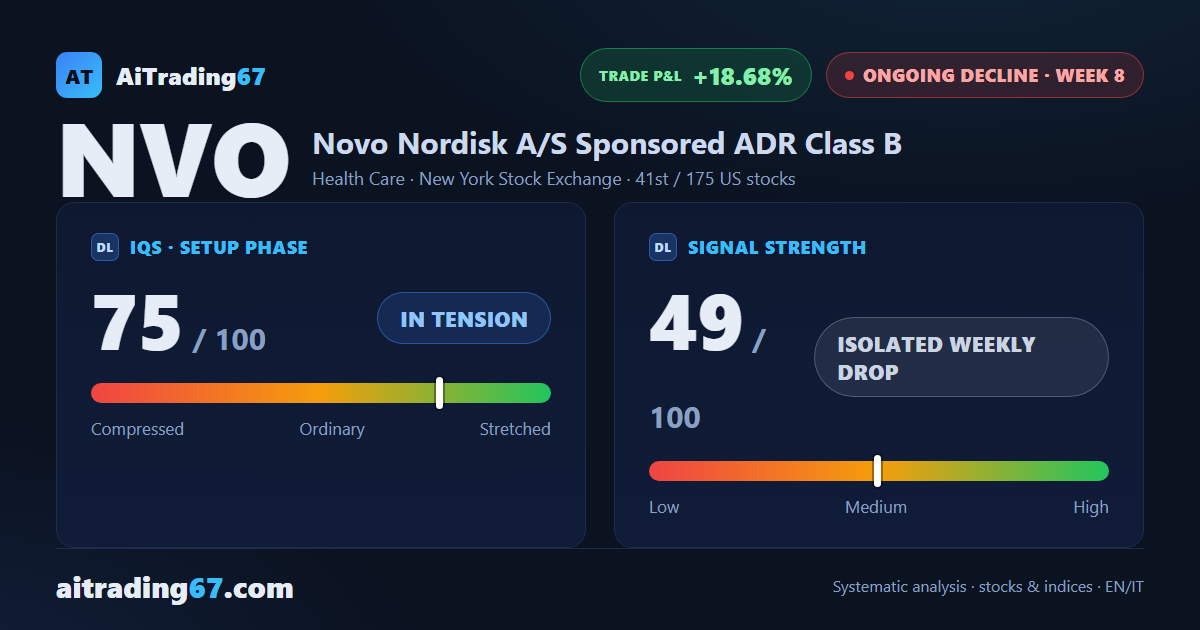
Ongoing decline · week 8 · US stocks
Novo Nordisk sheds another 3.8% and sets a fresh 90-day low as the daily RSI sinks to 27
Our view last week
After last week's pause, sellers are back on Novo Nordisk: the week closes down 10.3%, with 73% of the weekly bar's volume on the sell side. Novo Nordisk stock, a weak spot among US stocks this week, stays below the Ichimoku cloud, with the MACD under its signal line and money flow negative for a 4th week. On the daily chart the price action prints lower highs, from 48 down to 44, and the short, a swing trading position, is now more than 15% in profit.
This week's summary
After last week's 10.3% slide, Novo Nordisk drops another 3.8% and sets a fresh 90-day low, confirmed by the weekly close. On the technical analysis side, Novo Nordisk stock shows money flow negative for a 5th week, and the daily price action now counts 4 lower highs, from the 44 area down to the 39 area. A daily RSI at 27 says the decline is already stretched, though: the short, a swing trading position among US stocks, is more than 18% in profit.
IQS Phase
75
in tension
Signal Strength
49
isolated weekly drop
Sizing
REDUCED
Ranking
#41 / 175
US stocks
Trade P&L %
+18.68%
from signal to date, no stop loss
Novo Nordisk (NVO) weekly chart — EMA50 · MACD · VWAP
Weekly chart · EMA50 · MACD · VWAP · Source: TradingView
Rank position
ranks 41st among the 175 sell signals for US stocks in our ranking, with a signal strength of 49 out of 100.
Sector context
SectorHealth Care
Benchmark ETFXLV
Sector regimein positive regime
Performanceweekly -2.65% · monthly -3.91%
NVO belongs to the health care sector (reference ETF XLV). The sector is classified in positive regime according to our weekly reading.
restricted Platinum content