
ServiceNow, second week of the buy
ServiceNow gains 3.6% as the buy signal holds firm
Our view last week
After the 12.3% post-earnings rally, ServiceNow stock closes its confirmation week down 0.7%, with a bearish engulfing candle on the daily chart and volume drying up. The weekly structure still holds — RSI at 55, MACD improving — and the buy signal stands: only a break above the 130 area is missing for the full breakout. Technical analysis on ServiceNow stock stays on watch for that confirmation.
This week's summary
ServiceNow closes the week up 3.6%, hugging the upper Bollinger band and a step away from the seven-session high, in the 131 area. On the daily chart the bounce off the EMA20 (120 zone) drove an 8% rebound from the session lows. Under the surface, a few cracks: weekly volume is contracting and buyer dominance is fading. The buy signal, which fired two weeks ago, is holding and waiting for a close above the 131 area for the real leg higher.
IQS Phase
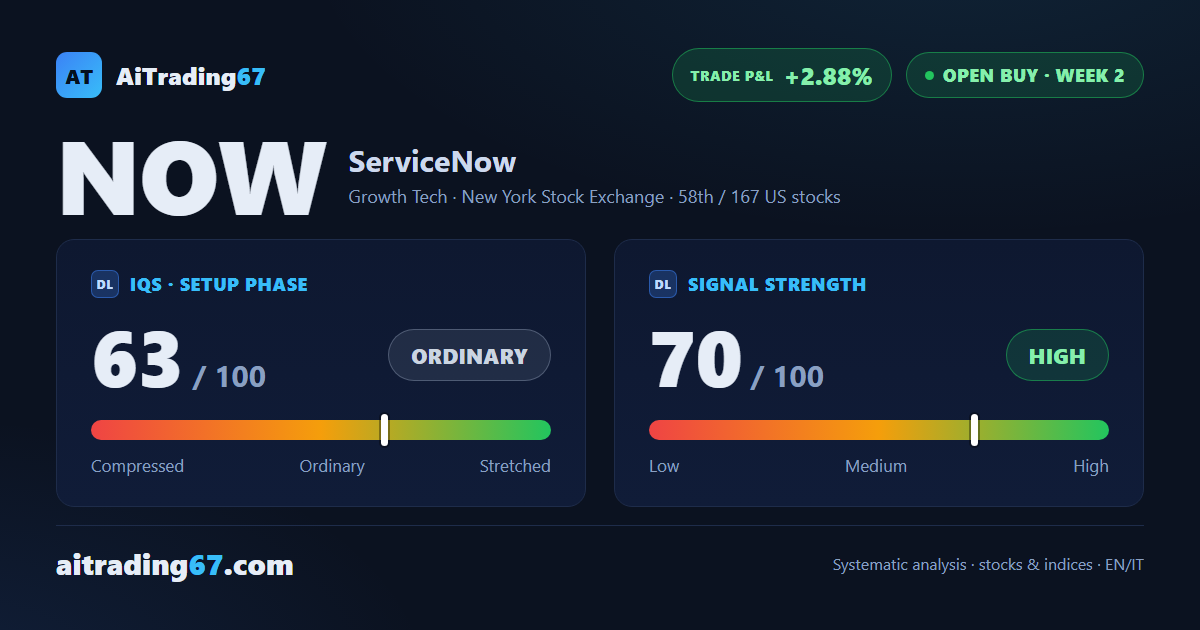
63
ordinary
Signal Strength
70
high · wide & volatile
Sizing
FULL
Ranking
#58 / 167
US stocks in progress
Trade P&L %
+2.88%
from signal to date, no stop loss
Rank position
ranks 58th among the 167 Longs already running for US stocks in our ranking, with a signal strength of 70 out of 100.
Sector context
SectorGrowth Tech
Benchmark ETFXLK
Sector regimeweak phase
Performanceweekly -3.53% · monthly +1.69%
NOW belongs to the growth tech sector (reference ETF XLK). The sector is classified weak phase according to our weekly reading.
restricted Platinum content