
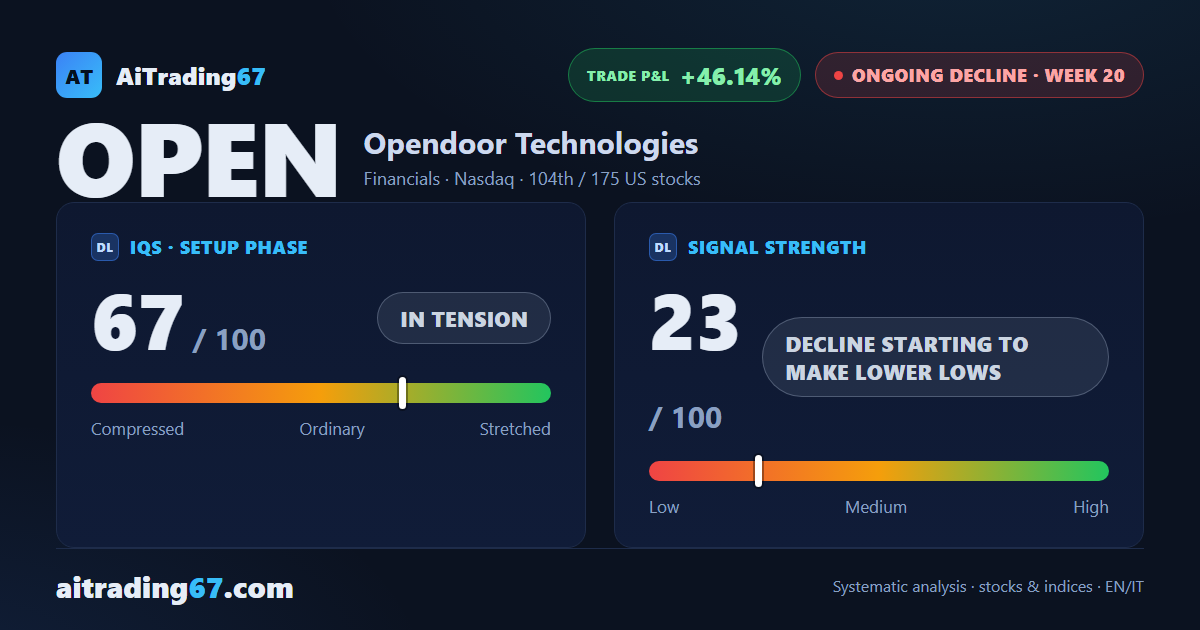
Ongoing decline · week 20
Opendoor falls 5.1% to a new 30-week low, yet closes well off the week's bottom
Our view last week
After 5 straight down weeks, Opendoor stalls: the week closes up 0.4%, resting on its 30-day low in the 2.52 area. The pause brings no buyers back, with 83% of volume still on the sell side and money flow negative for 21 weeks. Technical analysis of Opendoor stock shows price action still pointing lower, with 3 lower highs on the daily chart, while the short under management stays more than 43% in profit.
This week's summary
Last week's pause did not hold: Opendoor falls 5.1% and sets a new 30-week low in the 2.25 area, confirmed by the weekly close. Off that low the price recovered, and the week closed in the upper half of its range for the first time in 4 weeks. Technical analysis of Opendoor stock still reads bearish: weekly RSI at 29.4, money flow negative for 22 weeks, price action on contracting volume. Among US stocks on a sell signal, this short is more than 46% in profit.
IQS Phase
67
in tension
Signal Strength
23
decline starting to make lower lows
Sizing
MINIMUM
Ranking
#104 / 175
US stocks
Trade P&L %
+46.14%
from signal to date, no stop loss
Opendoor Technologies (OPEN) weekly chart — EMA50 · MACD · VWAP
Weekly chart · EMA50 · MACD · VWAP · Source: TradingView
Rank position
ranks 104th among the 175 sell signals for US stocks in our ranking, with a signal strength of 23 out of 100.
Sector context
SectorFinancials
Benchmark ETFXLF
Sector regimeweak phase
Performanceweekly -2.46% · monthly -7.23%
OPEN belongs to the financials sector (reference ETF XLF). The sector is classified weak phase according to our weekly reading.
restricted Platinum content