
Sell signal in observation · week 3
Rivian drops 7.6% as the 50-week average turns the bounce away and the decline resumes
Our view last week
After last week's range break, Rivian stock recovered 3.2%, and the bounce stalled right below a band of moving averages between the 15.6 and 15.9 areas, which had already pushed it back during the week. On technical analysis the picture stays bearish, with money flow negative for 9 weeks; the price action, though, shows an indecisive weekly candle and a decline losing steam. The sell signal is still waiting for its confirmation to play out.
This week's summary
Last week's bounce died at the 50-week moving average, in the 15.6 area: Rivian stock fell 7.6% and is back just above its 90-day low, in the 14 area. On technical analysis the weekly picture stays bearish, with price action printing lower highs on the daily chart and money flow negative for 10 weeks. The Sell signal has found its stride again; among US stocks, though, this trade setup still rates as high-risk for a fresh short on our model.
IQS Phase
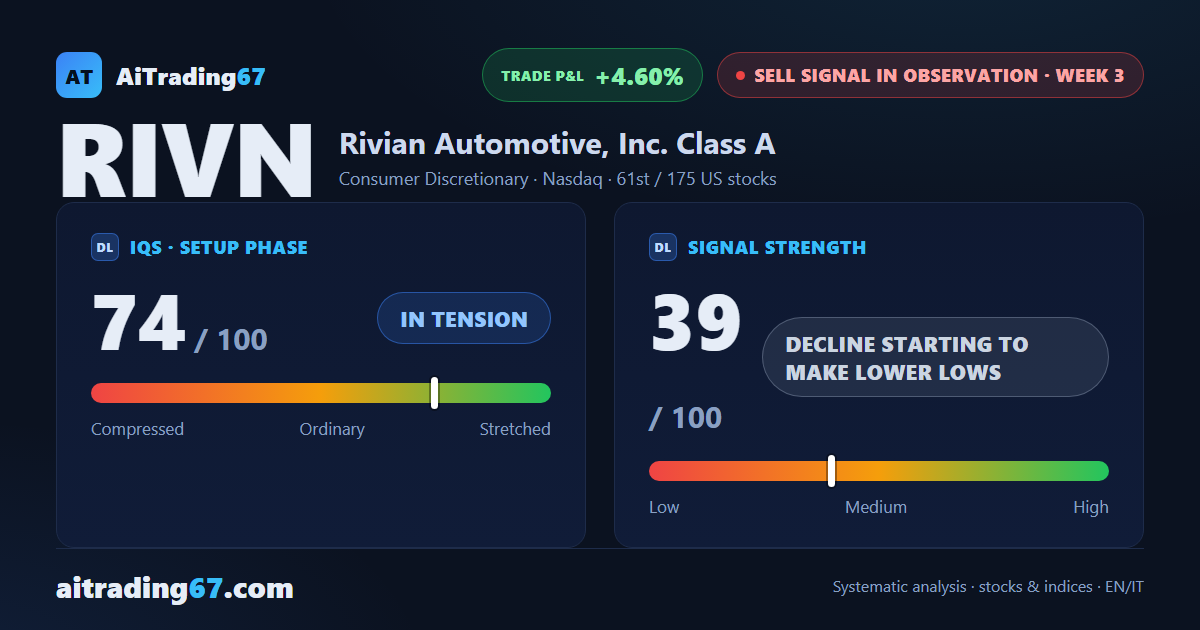
74
in tension
Signal Strength
39
decline starting to make lower lows
Sizing
REDUCED
Ranking
#61 / 175
US stocks sell signals
Trade P&L %
+4.60%
from signal to date, no stop loss
Rivian Automotive (RIVN) weekly chart — EMA50 · MACD · VWAP
Weekly chart · EMA50 · MACD · VWAP · Source: TradingView
Rank position
ranks 61st among the 175 sell signals for US stocks in our ranking, with a signal strength of 39 out of 100.
Sector context
SectorConsumer Discretionary
Benchmark ETFXLY
Sector regimeweak phase
Performanceweekly -0.47% · monthly -4.20%
RIVN belongs to the consumer discretionary sector (reference ETF XLY). The sector is classified weak phase according to our weekly reading.
restricted Platinum content