
Sell signal, week 7: a double-digit rebound
Royal Caribbean jumps 14.4% and stalls just under its moving averages in the 279 area
Our view last week
After 7 weeks of sellers in charge, buyers narrowly retake the majority on Royal Caribbean stock, with 52% of the volume. Price still slips 1.3%, a 7th straight losing week, after reaching down to the 7-day low in the 222 area. The MACD keeps worsening and the short is 16.9% in profit: a swing trading case among US stocks, to follow with technical analysis week by week.
This week's summary
Royal Caribbean breaks a run of 7 losing weeks with a 14.4% rebound that carries price up to touch the 20-week moving average, in the 279 area, without closing above it. On Royal Caribbean stock the sell signal stays live and the technical analysis is split: price action speeds up, the weekly MACD is still below its Signal line. Price closed above the first stop level (SL1) and the second stop level (SL2) flagged in last week's card (267.9 area, 273 area): for anyone following those levels the trade is closed. The close and the Inversion Point, in the 270 area, have already crossed with no change of sign declared: one to watch in the coming sessions.
IQS Phase
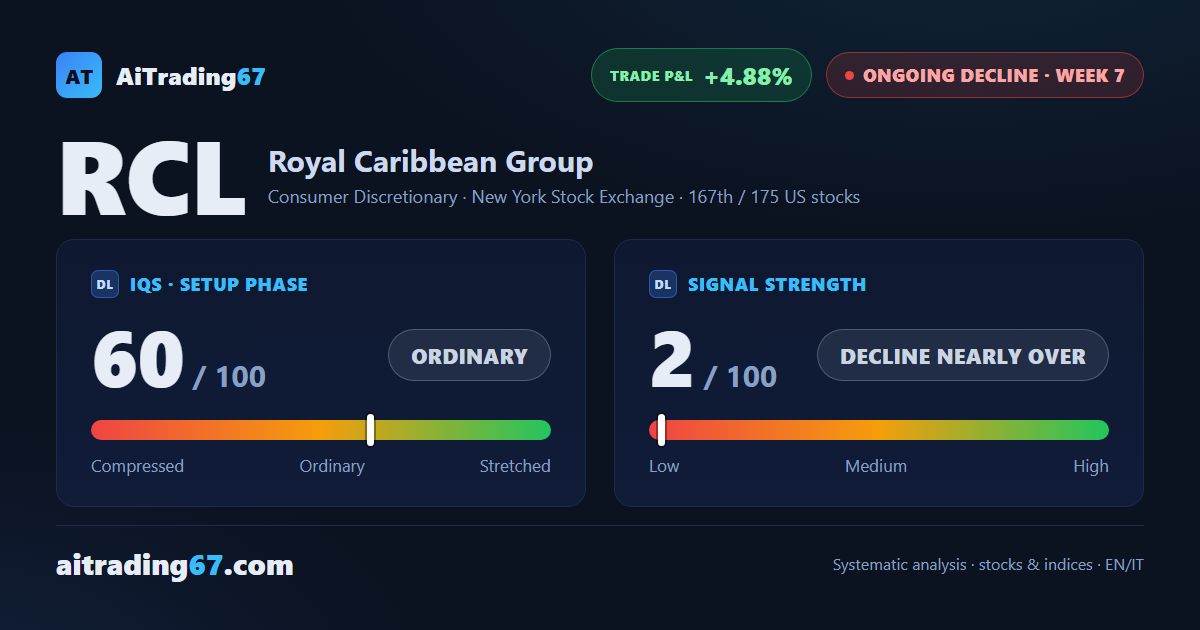
60
ordinary
Signal Strength
2
decline nearly over
Sizing
MINIMUM
Ranking
#167 / 175
US stocks
Trade P&L %
+4.88%
from signal to date, no stop loss
Royal Caribbean (RCL) weekly chart — EMA50 · MACD · VWAP
Weekly chart · EMA50 · MACD · VWAP · Source: TradingView
Rank position
ranks 167th among the 175 sell signals for US stocks in our ranking, with a signal strength of 2 out of 100.
Sector context
SectorConsumer Discretionary
Benchmark ETFXLY
Sector regimeweak phase
Performanceweekly -0.47% · monthly -4.20%
RCL belongs to the consumer discretionary sector (reference ETF XLY). The sector is classified weak phase according to our weekly reading.
restricted Platinum content