
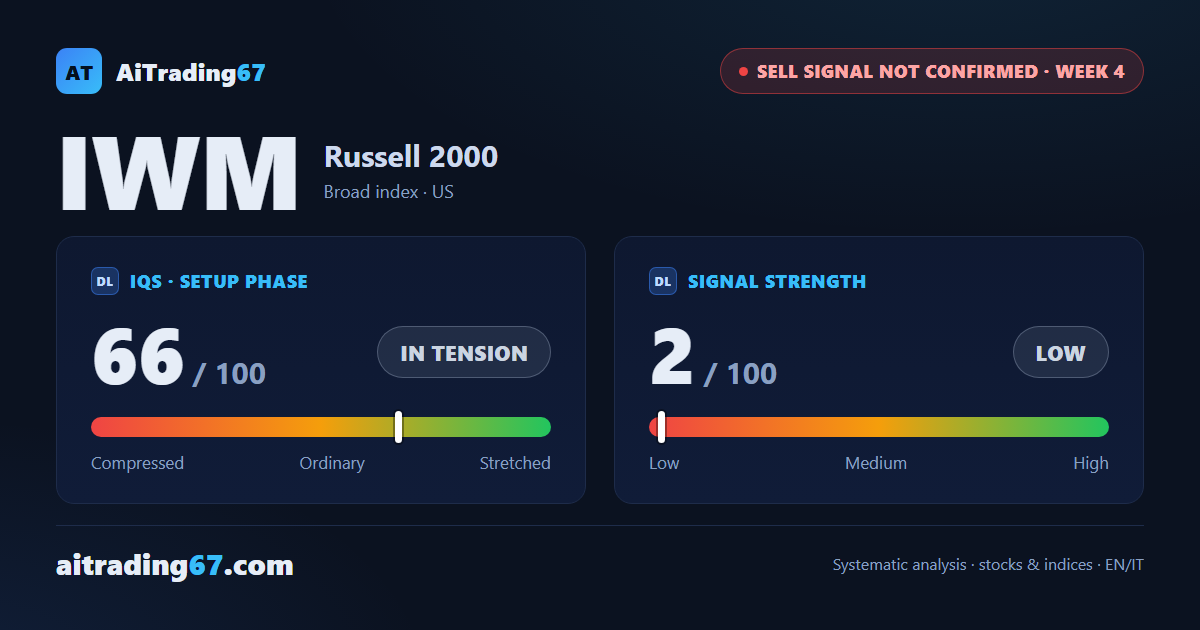
Russell 2000 · Sell Signal not confirmed
IWM (Russell 2000): new low not confirmed at the close, a sell with little thrust
Our view last week
The IWM, the Russell 2000 ETF, closes lower for a 3rd straight week: the 20-week average turned back another attempt to climb, and the week's low slipped under the 281 area, which had held last week, down to the 279 area. Money flow stays negative, yet the slide carries little thrust of its own, with Signal Strength on the sell at 9 out of 100. For swing trading, the picture calls for patience, with price in the lower part of its neutral band.
This week's summary
The IWM, the Russell 2000 ETF, slips for a 4th straight week, with a price action detail that was missing seven days ago: the 30-day low was reset in the 275 area and the close came back above the old low, in the upper half of the range. The early-September Sell Signal ended its review without the 6% drop, and Signal Strength falls to 2 out of 100. For swing trading, the technical analysis still argues for patience while this trade setup stays unresolved.
IQS Phase
66
in tension
Signal Strength
2
low · fading
ATH distance
8.40%
8.40%
KPI 4
0/3
Russell 2000 (IWM) weekly chart — EMA50 · MACD · VWAP
Weekly chart · EMA50 · MACD · VWAP · Source: TradingView
restricted Platinum content