
Sell signal, week 2
Sanofi slips 1.4% to a new 90-week low, and the weekly close confirms it
Our view last week
After 11 weeks above its signal line, Sanofi's weekly MACD crosses bearish and the week closes down 3.1%: a fresh sell signal fires on Sanofi stock. The price action backs it, with sellers extremely dominant in the weekly bar and a strong distribution phase. Last week's 1.1% bounce failed to convince, and the price now sits right against its recent lows. Technical analysis calls for caution: for swing trading, opening a short here is high-risk.
This week's summary
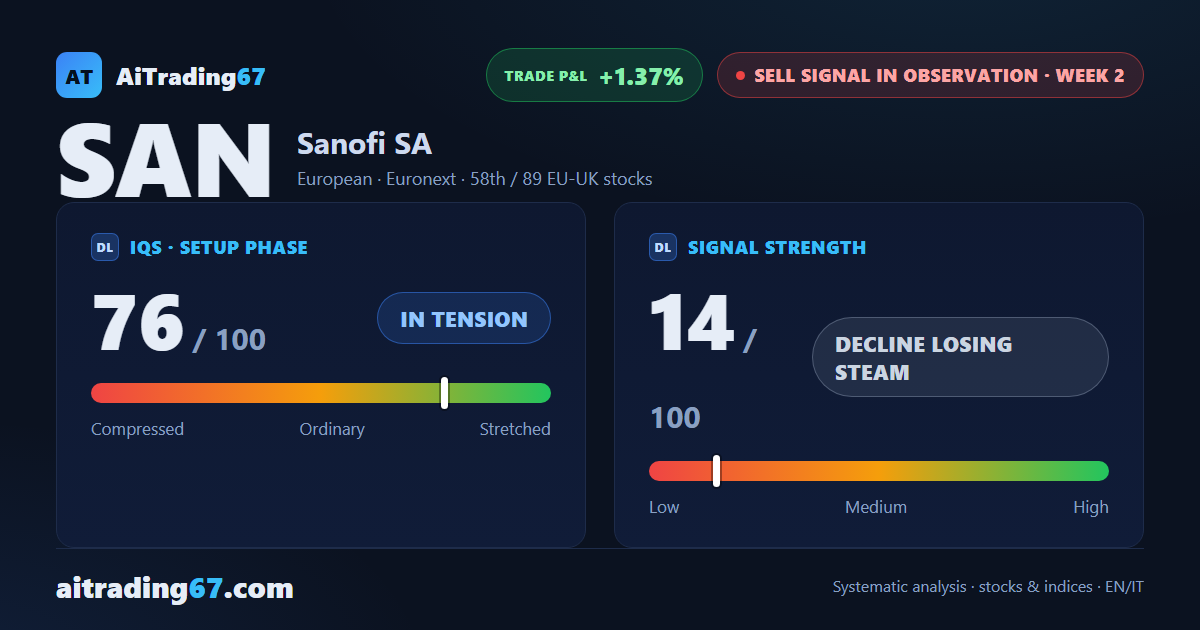
Sanofi prints a new 90-week low and confirms it on the close: the week sheds 1.4%, after the 3.1% drop that triggered the Sell signal 7 days ago. The price action stays in a distribution phase, with the weekly MACD below its signal line and money flow negative for 4 weeks. Meanwhile the decline is slowing its pace and Sanofi stock is hugging its lows: on our technical analysis, for swing trading, opening a short here stays high-risk.
Sell signal in observation
·2nd week from start
·EU-UK stocks
·T2
·📅 Earnings · Oct 30
★ See Gold version →
IQS Phase
76
in tension
Signal Strength
14
decline losing steam
Sizing
MINIMUM
Ranking
#58 / 89
EU-UK stocks sell signals
Trade P&L %
+1.37%
from signal to date, no stop loss
Sanofi (SAN) weekly chart — EMA50 · MACD · VWAP
Weekly chart · EMA50 · MACD · VWAP · Source: TradingView
Rank position
ranks 58th among the 89 sell signals for European-UK stocks in our ranking, with a signal strength of 14 out of 100.
Sector context
SectorEuropean
Benchmark ETFEXV4
Sector regimeweak phase
Performanceweekly -2.52% · monthly -5.64%
SAN belongs to the european sector (reference ETF EXV4). The sector is classified weak phase according to our weekly reading.
restricted Platinum content