
Saint-Gobain, the rally loses steam
Saint-Gobain slips 3.3% and squeezes between two tight moving averages
Our view last week
Saint-Gobain stock slips 1.8% this week as sellers regain control and volume contracts: the rally loses some steam, but the structure holds above the 50-week average. This weekly technical analysis confirms the buy signal that fired two weeks ago, with the trade up 3.27% since entry, while the decisive breakout level stays just overhead, in the 87.2 area.
This week's summary
Saint-Gobain slips 3.3% in a week with sellers slightly in control and candle-body conviction gradually fading: the structure shifts from bullish to neutral, with only two of the four moving averages aligned and price compressed just under the 50-week average. MACD is worsening but still sits above the Signal line, a gap that has held for 17 weeks. The buy signal, fired three weeks ago, stays open: confirmation was positive, and the push is now cooling without breaking down.
IQS Phase
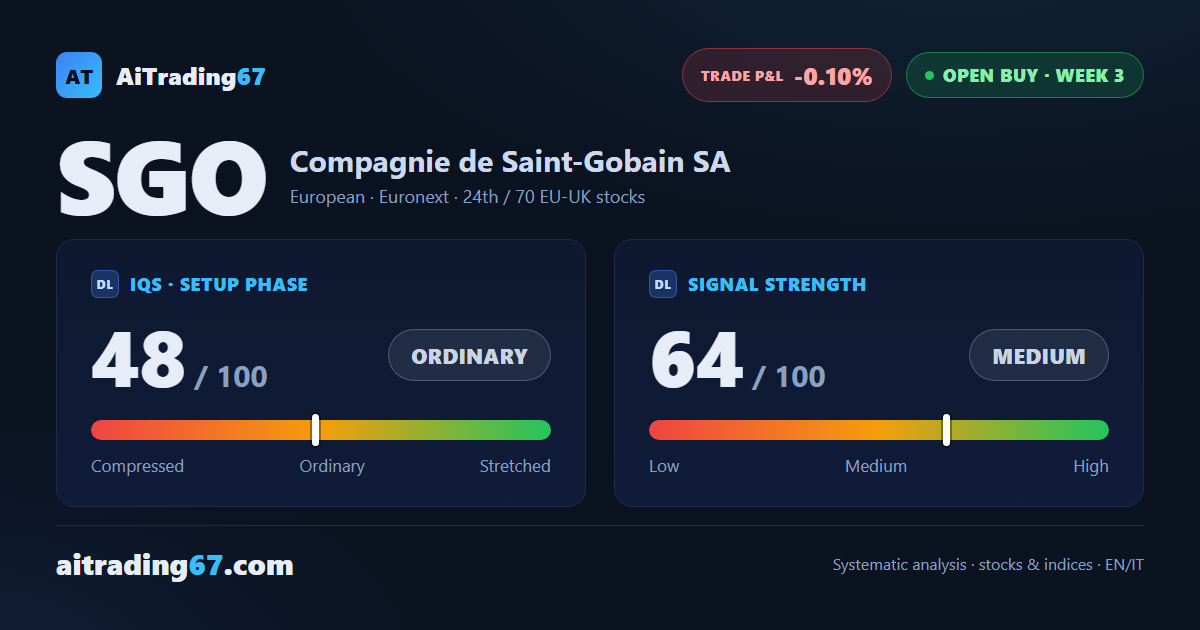
48
ordinary
Signal Strength
64
medium
Sizing
STANDARD
Ranking
#24 / 70
EU-UK stocks in progress
Trade P&L %
-0.10%
from signal to date, no stop loss
Rank position
ranks 24th among the 70 Longs already running for European-UK stocks in our ranking, with a signal strength of 64 out of 100.
Sector context
SectorEuropean
Benchmark ETFEXH4
Sector regimein positive regime
Performanceweekly -1.99% · monthly +4.11%
SGO belongs to the european sector (reference ETF EXH4). The sector is classified in positive regime according to our weekly reading.
restricted Platinum content