
US stocks · Open buy, week 8
Snap gains 3% on a bounce off its 20-day average, but the 200-day line pushes back
Our view last week
Snap stock closed the week down 2%, its second straight loss, and in the weekly bar sellers are still ahead, with distribution underway. In recent sessions, though, the price action shows a 3% bounce from the 5.2 area, back above the 50-day average in the 5.4 area, and money flow is rising again after 2 weeks of decline. The buy signal stays in profit: for swing trading, the level to watch is the 7-day high, in the 6.04 area.
This week's summary
Snap stock is rising again: up 3% on the week after 2 straight losses, with a 4% rebound off the 20-day moving average in the 5.5 area. A week ago the price action showed the first signs of a reaction; now the recovery is here, but it stalled below the 200-day average, in the 5.83 area, which firmly rejected the price. Money flow has improved for 2 weeks but stays negative. For swing trading the level to watch is the 7-day high, in the 5.79 area: the weekly buy signal remains in profit.
IQS Phase
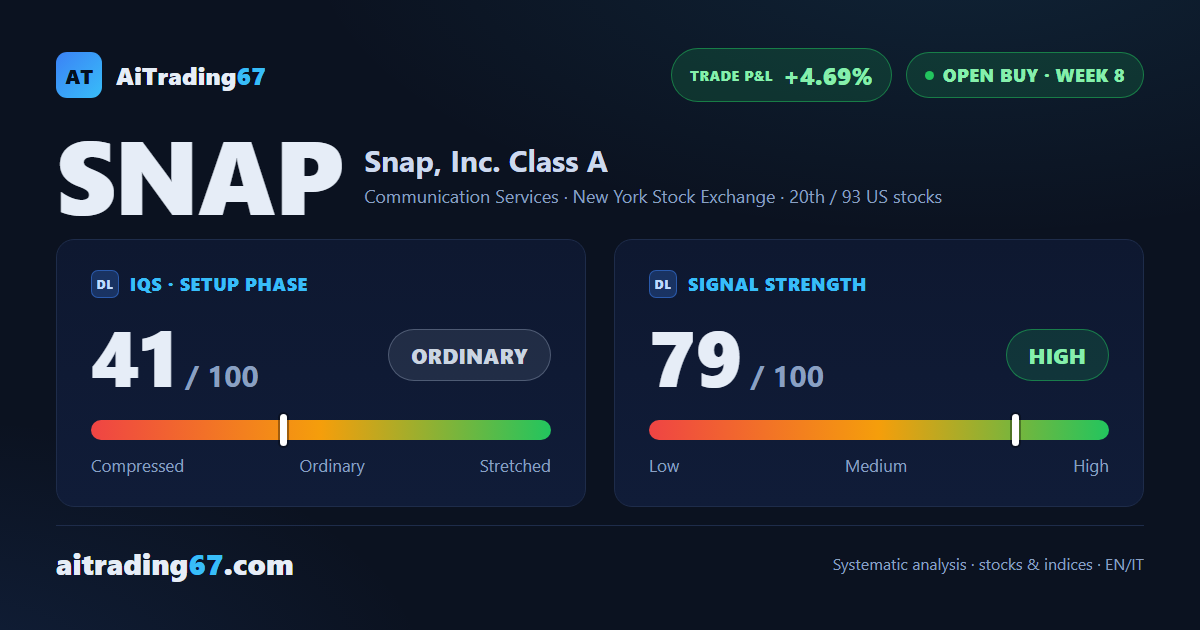
41
ordinary
Signal Strength
79
high · wide & volatile
Sizing
FULL
Ranking
#20 / 93
US stocks in progress
Trade P&L %
+4.69%
from signal to date, no stop loss
Rank position
ranks 20th among the 93 Longs already running for US stocks in our ranking, with a signal strength of 79 out of 100.
Sector context
SectorCommunication Services
Benchmark ETFXLC
Sector regimein positive regime
Performanceweekly -2.34% · monthly -1.87%
SNAP belongs to the communication services sector (reference ETF XLC). The sector is classified in positive regime according to our weekly reading.
restricted Platinum content