
Weekly technical analysis · S&P 500 ETF
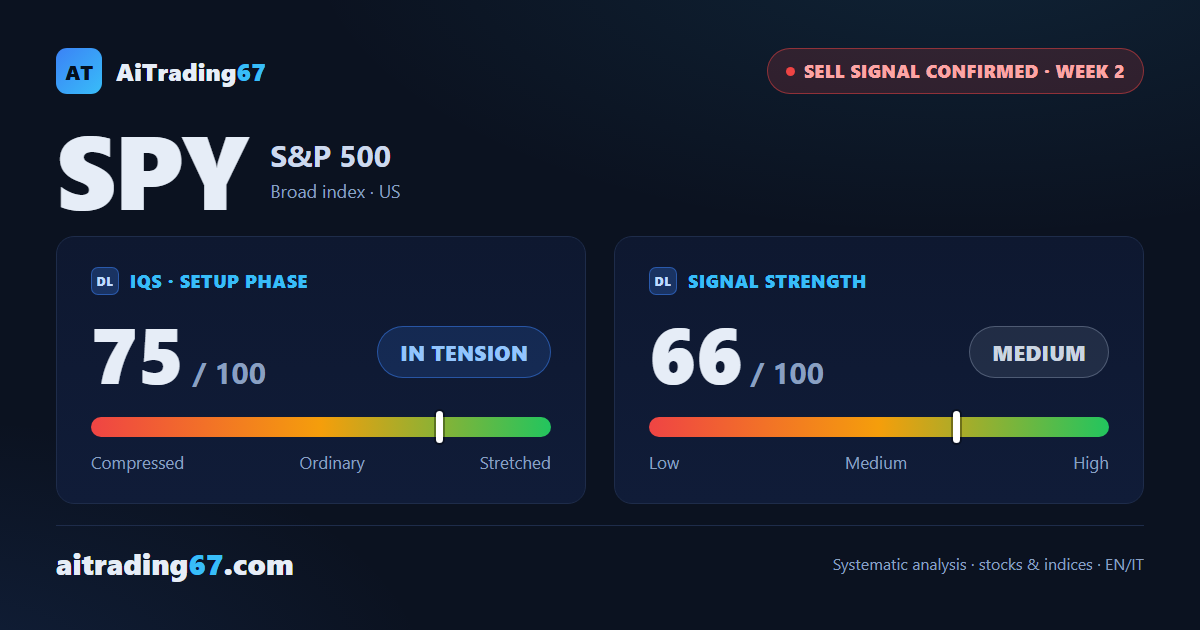
SPY (S&P 500): sell signal confirmed as tech sheds 12.5% and the 717 area gives way
Our view last week
SPY, the S&P 500 ETF, climbs 2.6% in the first week after its sell signal: the slide halted at the 200-day average, and technology, a third of the basket, recovers 3.36%. The technical analysis still leans bearish, with the MACD below its signal line for 10 weeks and money flow negative. The 3-week review needs a 6% drop: for now price is heading the other way, a short trade setup for swing trading that calls for patience.
This week's summary
SPY, the S&P 500 ETF, confirms its sell signal: technology, a third of the basket, loses 12.5% on the week and price ends 6.2% below the signal close, past the 6% threshold. Last week's bounce off the 200-day average has faded, and the 24-week low in the 717 area broke on a closing basis. The technical analysis is bearish and price action heavy, yet daily RSI is already oversold: a short trade setup for swing trading, to manage with discipline and no chasing.
Disclaimer. Technical analysis and personal opinion of the author, not financial advice or a personalised recommendation. The author may hold positions in the instruments analysed. Read more ▾Close ▴
Disclaimer — The content on this page is published for educational and informational purposes and represents the author's personal opinion and technical analysis. It is not financial advice, a solicitation to invest, or personalised recommendation. Trading financial instruments involves significant risks and may result in the loss of all or part of the invested capital. Every operational decision is the sole responsibility of the user, who acknowledges acting in full autonomy and full awareness of risk. The author may hold, open or close positions in the instruments analysed, including positions opposite to the analysis, before or after publication, with no obligation to disclose them.
restricted Platinum content