
Emerging markets ETF · buy signal, week 6
SPEM slips 1.2% and backs away from its highs as the 20-week average holds again
Our view last week
SPEM, the emerging markets ETF, is knocking on its highs for the 4th time in 10 weeks, and so far the wall in the 53.5 area holds: the week closes up 0.3%, less than 2% below the all-time high. SPEM technical analysis still reads bullish, with weekly averages aligned, but the MACD keeps fading and the price action shows sellers ahead in the weekly bar. For swing trading, the trade setup holds, still waiting for a fresh push.
This week's summary
SPEM, the emerging markets ETF, backs away from its highs: it slips 1.2% and prints a fresh 30-day low that the weekly close leaves unconfirmed. The 20-week average holds again. In SPEM technical analysis the weekly averages stay aligned to the upside, but MACD and price action say the buy signal is losing pace. Price closed below the breakeven stop flagged in last week's card (52.38 area): for anyone following that level the trade is closed.
IQS Phase
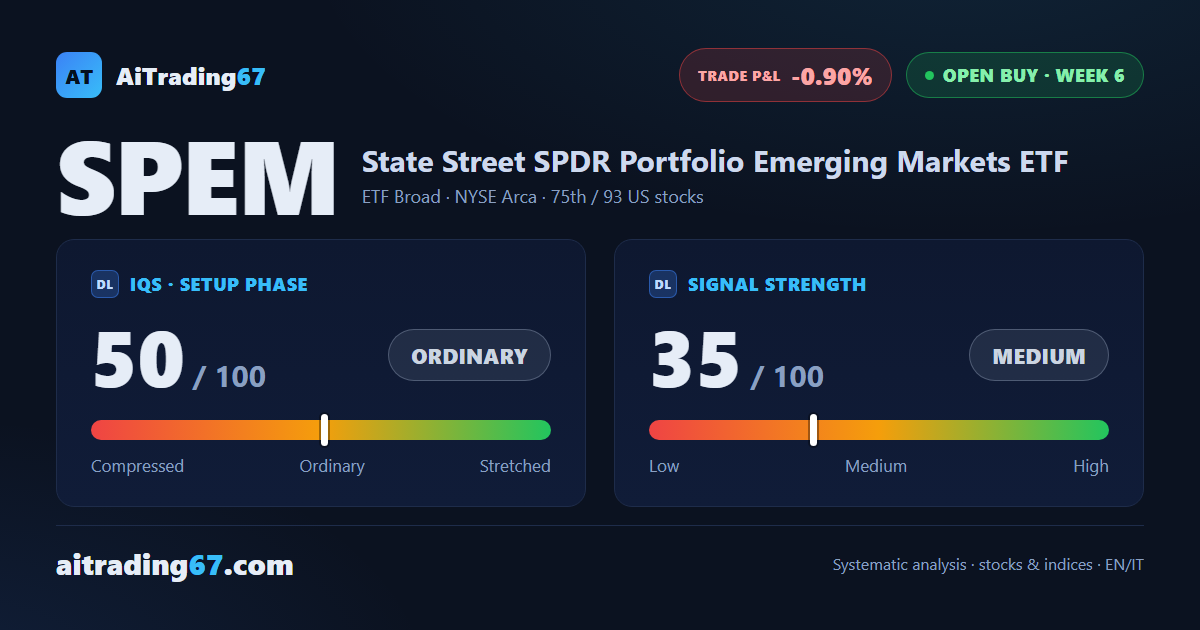
50
ordinary
Signal Strength
35
medium · weak
Sizing
REDUCED
Ranking
#75 / 93
US stocks in progress
Trade P&L %
-0.90%
from signal to date, no stop loss
SPEM Emerging Markets weekly chart — EMA50 · MACD · VWAP
Weekly chart · EMA50 · MACD · VWAP · Source: TradingView
Rank position
ranks 75th among the 93 Longs already running for US stocks in our ranking, with a signal strength of 35 out of 100.
Sector context
SectorETF Broad
Benchmark ETF—
Sector regime
Performanceweekly coming soon · monthly coming soon
SPEM belongs to the etf broad sector (reference ETF ).
restricted Platinum content