
Sell signal, week 4 · US stocks
Starbucks slips 0.2% as the 200-week average holds and the decline loses its push
Our view last week
Starbucks slips 1%, stretching its losing run to 4 weeks, but the stride has changed: a week ago sellers were in full control, this week buyers took the upper hand in the weekly bar. For Starbucks stock the sell signal is losing steam, while the cluster of moving averages in the 98-99 area keeps pushing price back. Daily price action is still bearish, with 3 lower highs from the 108 area to the 99 area: one of the US stocks to watch this week.
This week's summary
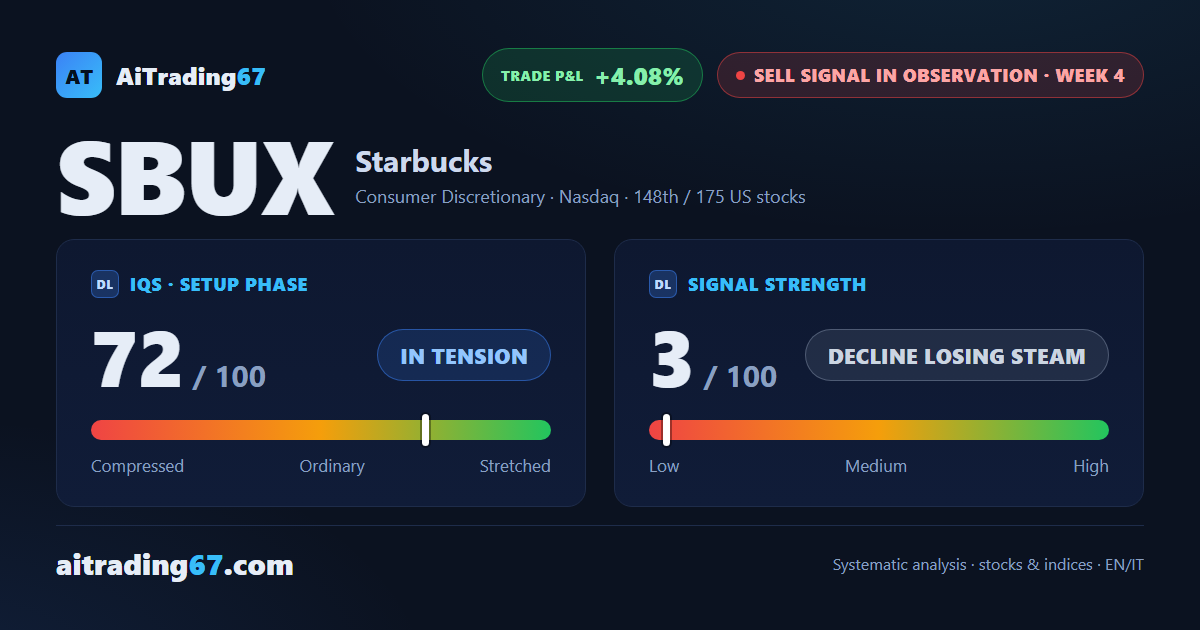
Starbucks ends the week almost flat, down 0.2%, yet it is the 5th straight weekly decline and price dropped to touch the 200-week moving average, in the 94 area, which held. A week ago the Sell signal was losing steam; now signal strength is down to 3 out of 100, a decline with no fresh push. For Starbucks stock the daily price action is still weak, with 3 lower highs from the 102 area to the 96 area: one of the US stocks to watch, with technical analysis pointing to patience.
Sell signal in observation
·4th week from start
·US stocks
·T2
·📅 Earnings · Oct 29
★ See Gold version →
IQS Phase
72
in tension
Signal Strength
3
decline losing steam
Sizing
MINIMUM
Ranking
#148 / 175
US stocks sell signals
Trade P&L %
+4.08%
from signal to date, no stop loss
Starbucks (SBUX) weekly chart — EMA50 · MACD · VWAP
Weekly chart · EMA50 · MACD · VWAP · Source: TradingView
Rank position
ranks 148th among the 175 sell signals for US stocks in our ranking, with a signal strength of 3 out of 100.
Sector context
SectorConsumer Discretionary
Benchmark ETFXLY
Sector regimeweak phase
Performanceweekly -0.47% · monthly -4.20%
SBUX belongs to the consumer discretionary sector (reference ETF XLY). The sector is classified weak phase according to our weekly reading.
restricted Platinum content