
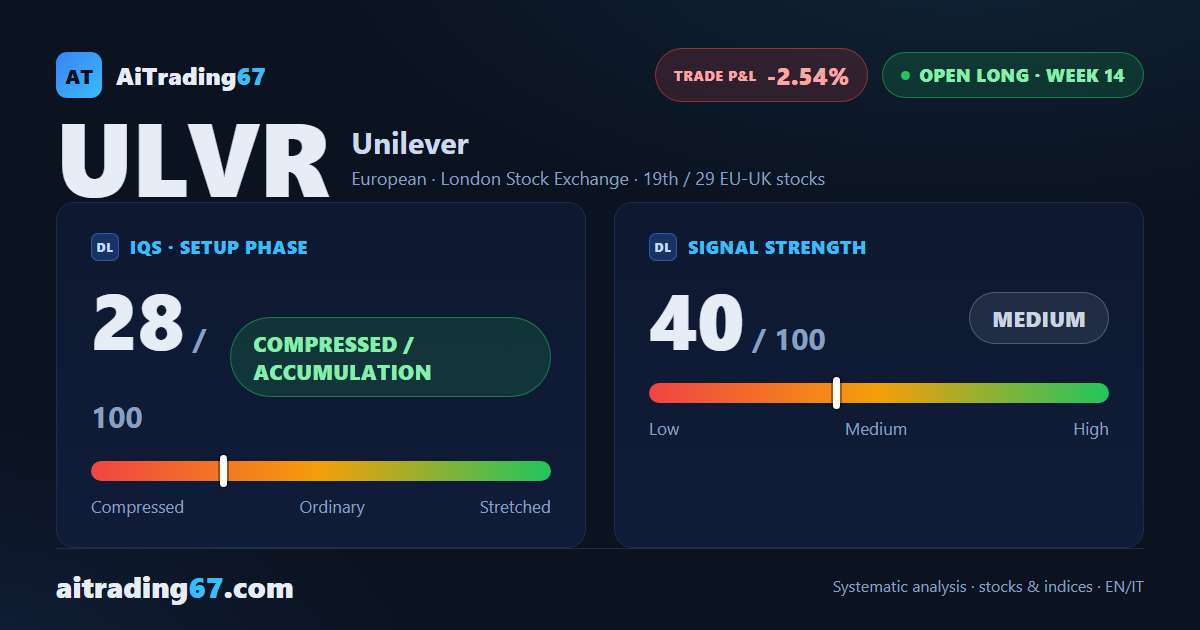
Open long, week 14
Unilever drops 3.9% to a fresh 30-day low as money flow stays negative
Our view last week
After 3 weeks ruled by sellers, Unilever stock closed 0.9% higher with 52% of volume on the buy side: two weeks ago selling made up 90%. The recovery has a flip side, though: weekly money flow drops below zero after 10 positive weeks, and the MACD histogram has been shrinking for 4 weeks. Technical analysis shows price pinned between the 20-day moving average, in the 4670 area, and the 50-day, in the 4651 area: price action still looking for direction.
This week's summary
Unilever fell 3.9% on the week, wiping out the 2 prior gains and carving a fresh 30-day low, in the 4463 area. For Unilever stock, technical analysis says the flip side flagged 7 days ago has taken over: money flow negative for a 2nd week, MACD histogram shrinking for 5. Price closed below the first stop level (SL1) and the second stop level (SL2) flagged in last week's card (4554.19 area, 4549.15 area): for anyone following those levels the trade is closed. The close and the Inversion Point, in the 4550 area, have already crossed with no change of sign declared: one to watch in the coming sessions.
IQS Phase
28
compressed / accumulation
Signal Strength
40
medium · weak
Sizing
REDUCED
Ranking
#19 / 29
EU-UK stocks in progress
Trade P&L %
-2.54%
from signal to date, no stop loss
Unilever (ULVR) weekly chart — EMA50 · MACD · VWAP
Weekly chart · EMA50 · MACD · VWAP · Source: TradingView
Rank position
ranks 19th among the 29 Longs already running for European-UK stocks in our ranking, with a signal strength of 40 out of 100.
Sector context
SectorEuropean
Benchmark ETFEXH7
Sector regime
Performanceweekly coming soon · monthly coming soon
ULVR belongs to the european sector (reference ETF EXH7).
restricted Platinum content