
Sell signal, week 3 · US total market ETF
VTI slips 0.5% in an indecisive week as the trend loses conviction for a 5th week
Our view last week
VTI, the Vanguard ETF that tracks the entire US stock market, recovered 1.2% with buyers in the majority for a 4th straight week, climbing back just under its Inversion Point, in the 382.5 area. The sell signal that fired seven days ago still has no push: strength is stuck at 2 out of 100, a decline fading out. For swing trading, VTI technical analysis flags trading as not recommended, with the confirmation week still open.
This week's summary
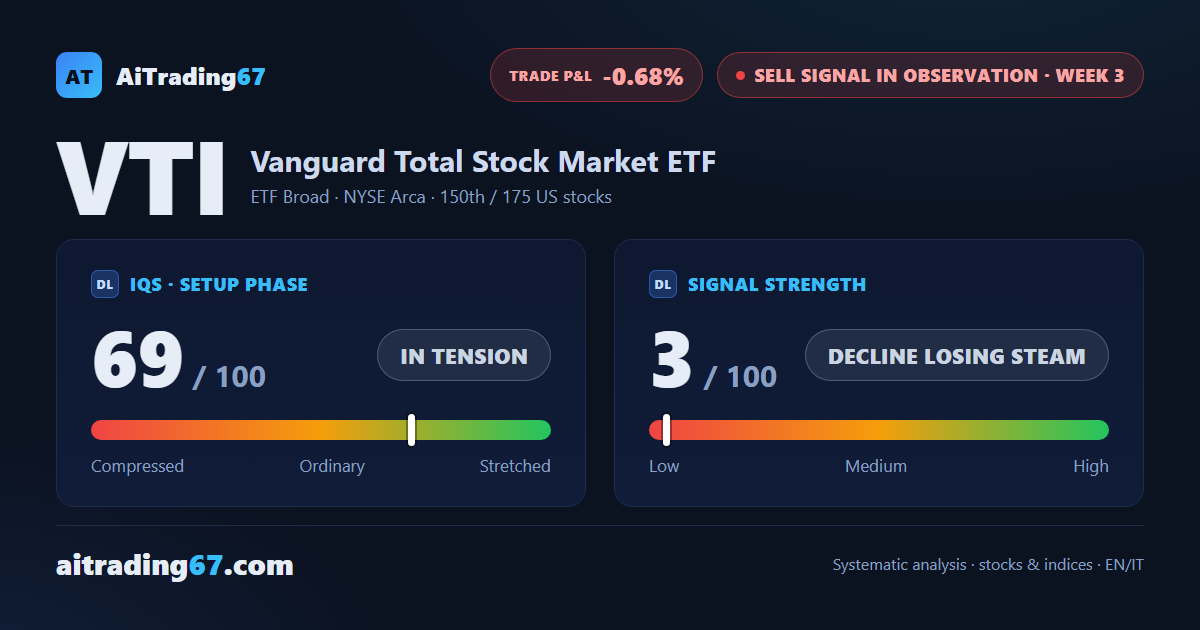
An indecisive week for VTI, the Vanguard ETF tracking the entire US stock market: a 0.5% slip on a narrow-bodied candle, after last week's recovery stalled under the Inversion Point, in the 382 area. VTI technical analysis shows a trend losing conviction, with the ADX falling for 5 weeks, and a Sell signal that still has no push: strength at 3 out of 100. For swing trading on US stocks, trading stays not recommended, and price action offers no clean trade setup.
IQS Phase
69
in tension
Signal Strength
3
decline losing steam
Sizing
MINIMUM
Ranking
#150 / 175
US stocks sell signals
Trade P&L %
-0.68%
from signal to date, no stop loss
VTI US Total Market weekly chart — EMA50 · MACD · VWAP
Weekly chart · EMA50 · MACD · VWAP · Source: TradingView
Rank position
ranks 150th among the 175 sell signals for US stocks in our ranking, with a signal strength of 3 out of 100.
Sector context
SectorETF Broad
Benchmark ETF—
Sector regime
Performanceweekly coming soon · monthly coming soon
VTI belongs to the etf broad sector (reference ETF ).
restricted Platinum content