
Buy signal, week 8: price back below entry
Walt Disney drops 3.7% after a rejection at its 200-week average
Our view last week
Walt Disney stock is lifting its head: up 3.4% on the week, winning back almost all of the previous week's drop with a bounce off its 20-day average and buyers back on top. Price is still boxed in, though, between the first support, the daily Inversion Point in the 105.9 area, and the first resistance in the 107.7 area, where the 200-week average also runs. Technical analysis of a buy signal now 1.2% up since entry: the price action is restarting, the bigger picture still needs confirming.
This week's summary
The 200-week moving average, in the 107.6 area, firmly turned Walt Disney stock away: the week closes down 3.7%, hands back all of last week's bounce and puts price back under the 20-week and 50-week averages. Technical analysis of one of the weekly buy signals on US stocks, now losing ground as the price action weakens. The close and the Inversion Point, in the 103 area, have already crossed with no change of sign declared: one to watch in the coming sessions. Price closed below the second stop level (SL2) flagged in last week's card (102.65 area): for anyone following that level the trade is closed.
IQS Phase
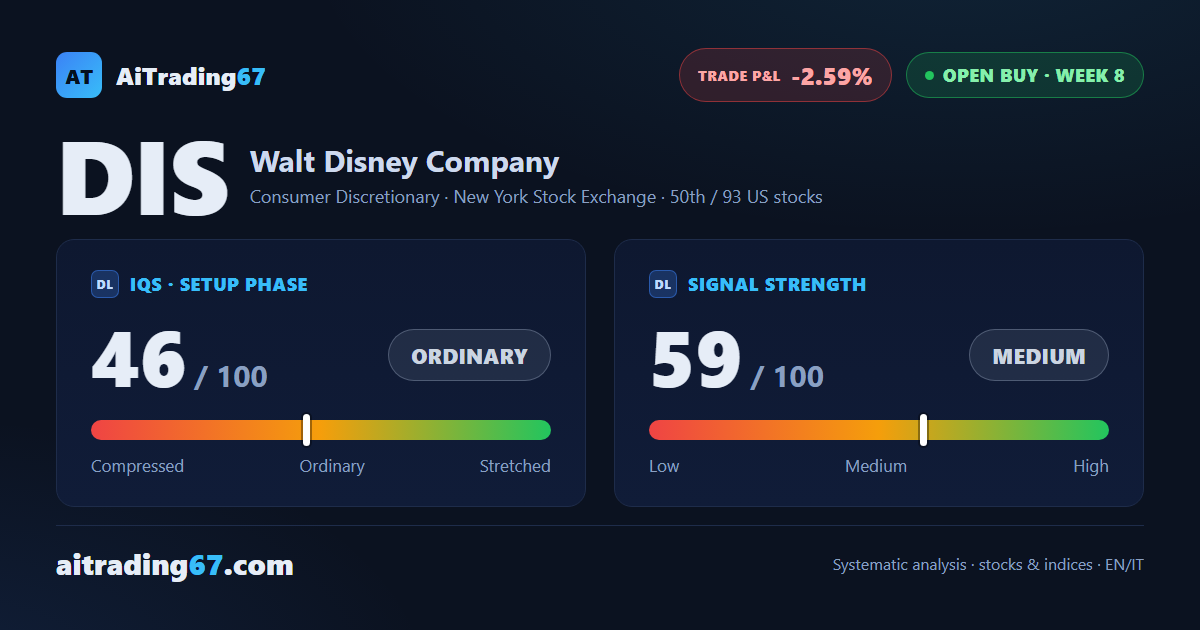
46
ordinary
Signal Strength
59
medium
Sizing
STANDARD
Ranking
#50 / 93
US stocks in progress
Trade P&L %
-2.59%
from signal to date, no stop loss
Walt Disney (DIS) weekly chart — EMA50 · MACD · VWAP
Weekly chart · EMA50 · MACD · VWAP · Source: TradingView
Rank position
ranks 50th among the 93 Longs already running for US stocks in our ranking, with a signal strength of 59 out of 100.
Sector context
SectorConsumer Discretionary
Benchmark ETFXLY
Sector regimeweak phase
Performanceweekly -0.47% · monthly -4.20%
DIS belongs to the consumer discretionary sector (reference ETF XLY). The sector is classified weak phase according to our weekly reading.
restricted Platinum content