
Buy signal · week 9 · trade up 11.5%
XLE slips 1.3% and stays glued to its highs as the buy signal turns 9 weeks old
Our view last week
XLE, the US energy sector ETF, closes the week up 1.7% and stays within a whisker of its record highs, already tested twice over the past ten weeks. On the daily chart price is forming three higher lows, but on the weekly the fatigue signs persist: contracting volume and sellers slightly prevalent on the last bar. The buy signal is in its 8th week and the trade is up 12.9% since entry.
This week's summary
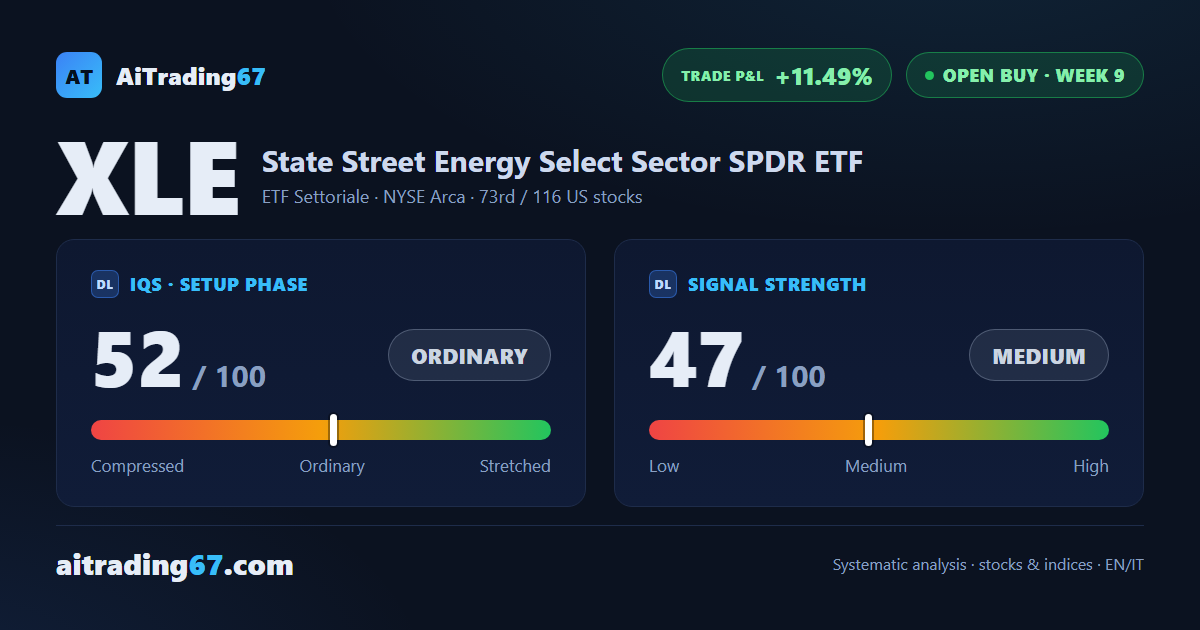
XLE slips 1.3% and stays within a whisker of its highs, already tested 3 times in the past 10 weeks. Weekly price action keeps sellers ahead for a third straight week, while ADX has been climbing for 6 weeks: the trend holds, the buying push is thinning. Technical analysis of XLE, the US energy sector ETF, finds the buy signal in week 9, with the trade up 11.5% since entry.
IQS Phase
52
ordinary
Signal Strength
47
medium · weak
Sizing
REDUCED
Ranking
#73 / 116
US stocks in progress
Trade P&L %
+11.49%
from signal to date, no stop loss
Rank position
ranks 73rd among the 116 Longs already running for US stocks in our ranking, with a signal strength of 47 out of 100.
Sector context
SectorETF Settoriale
Benchmark ETFXLE
Sector regimein positive regime
Performanceweekly -1.27% · monthly +1.15%
XLE belongs to the etf settoriale sector (reference ETF XLE). The sector is classified in positive regime according to our weekly reading.
restricted Platinum content