
US tech ETF · week 5 of the buy signal
XLK adds 1% and stays glued to its 7-day high: the breakout is still pending
Our view last week
XLK, the US technology sector ETF, edges up 0.2% but stalls below its 7-day high: the breakout attempt hasn't landed yet. Technical analysis of XLK shows the weekly picture fraying — ADX has fallen for 10 weeks and MACD sits below its Signal line, with volumes contracting. The buy signal moves into its 4th week: strength drops to 27 out of 100, from 29 last week, and the trade sits slightly in the red since entry.
This week's summary
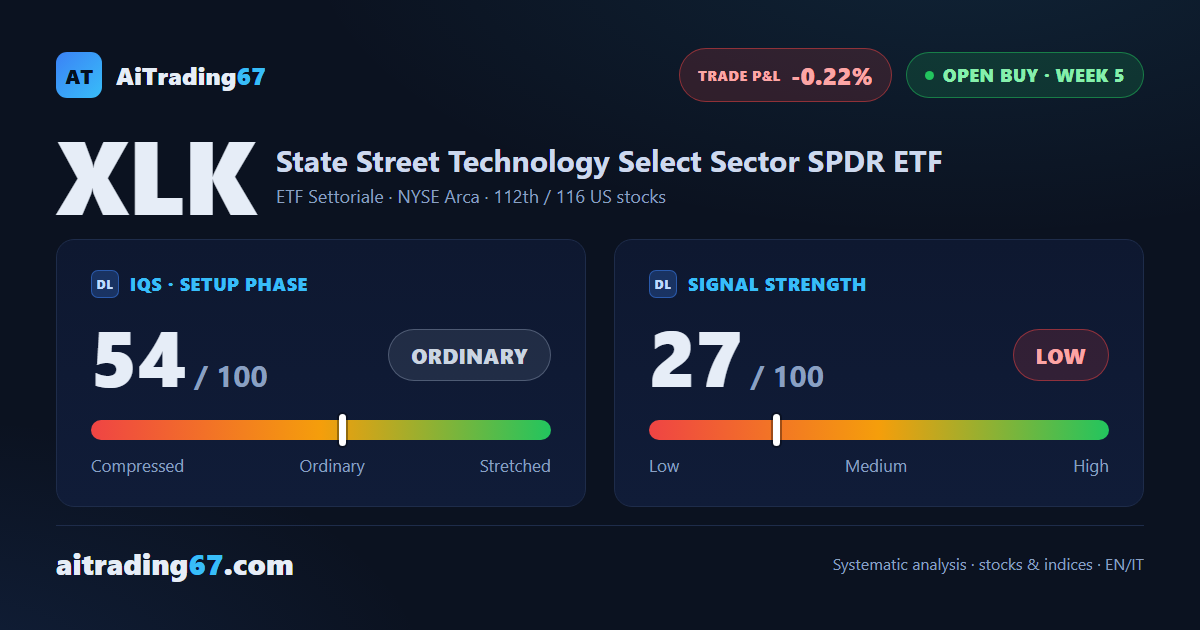
XLK, the US technology sector ETF, adds 1% and knocks again at its 7-day high, in the 189.8 area: the breakout stays pending for a second week. Price action trading helps the case — a 4% bounce off the 20-day average, with daily turnover almost entirely on the buy side — while XLK technical analysis on the weekly chart shows ADX falling for 11 weeks. The buy signal is in its 5th week and the trade sits a touch below entry: a swing trading setup still waiting for its trigger.
IQS Phase
54
ordinary
Signal Strength
27
low · fading
Sizing
MINIMUM
Ranking
#112 / 116
US stocks in progress
Trade P&L %
-0.22%
from signal to date, no stop loss
Rank position
ranks 112th among the 116 Longs already running for US stocks in our ranking, with a signal strength of 27 out of 100.
Sector context
SectorETF Settoriale
Benchmark ETFXLK
Sector regimein positive regime
Performanceweekly +1.03% · monthly +3.25%
XLK belongs to the etf settoriale sector (reference ETF XLK). The sector is classified in positive regime according to our weekly reading.
restricted Platinum content