
EN IT

Netflix stock analysis: the market did not punish the quarter, it punished the visibility

Netflix stock analysis after the results: earnings beat consensus, revenue missed by two tenths, and the stock still fell 7.26%. The market did not punish the quarter — it punished the narrowed guidance. On the chart the sell signal has been active for eleven weeks.

Netflix stock analysis: the market did not punish the quarter, it punished the visibility
Stay updated
Don't miss the next World Observatory
Get an email with every new World Observatory. Free, unsubscribe in one click.
World Observatory updates only.
Done! Check your inbox to confirm your subscription.
Something went wrong. Please try again shortly.
Want World Observatory by email too?
You're already with us: add World Observatory to your emails from your preferences.
Manage your emails →
Netflix Stock Analysis · Guidance vs Quarter
Netflix stock analysis: the market did not punish the quarter, it punished the visibility
July 18, 2026 — Fabio Gentili observatorytrading
The session
Netflix stock analysis after a result worth studying. Earnings per share came in above consensus and revenue two tenths of a point below: numbers almost in line. The stock opened down nearly 12% and closed at −7.26%. What hurt was the third-quarter guidance and the cut to the engagement metrics the company discloses: you do not pay for yesterday's numbers, you pay for tomorrow's visibility. On the chart, though, this story had been running since April. Below: what happened, the levels that matter and the swing trading plan.
AiTrading67.com

What happened
🇺🇸
EARNINGS
Numbers in line, outlook narrowed
High tension
A beat on profit, a crash on the outlook
Second-quarter revenue landed at $12.56bn against a $12.59bn consensus — 0.2% short — while adjusted earnings per share came in at $0.80 against $0.79 expected, so above. The quarter itself is not the problem.
The problem is the third-quarter guidance, narrowed to a $51.0–51.4bn range, together with the reduction in the engagement metrics disclosed to the market. When a company stops publishing figures it used to publish, the market prices the worst case.
The session itself carries a detail worth keeping: after the opening collapse the stock recovered almost 6% off the day's worst level, and 87.8% of the volume on that bar went through on the buy side. The blow landed; the capitulation did not.
Context: it was a week in the red on every front (S&P 500 −1.02%, Nasdaq −1.40%), with Alphabet delaying its flagship model and triggering another sell-off across semiconductors — AMD −5%, Intel −4%, Nvidia −3%, STMicroelectronics −4%. Technology (XLK) lost 1.1% on the day and 5.5% on the week, communications (XLC) 1.8%: no sector cushion anywhere. American money went to one place only, energy (XLE, +1.2%).
AiTrading67.com
📉
TECHNICALS
Netflix stock analysis: structure and levels
Trend intact
Netflix technical analysis: the chart had been saying it since April
The weekly has no mitigating factors. Price below the moving averages at 20, 50, 100 and 200 periods, below the Ichimoku cloud, moving average convergence (MACD) negative and under its signal line. The negative directional sits at 44.4 against a positive at 4.6 — an imbalance you rarely see. Money flow out in full, with Chaikin (CMF) at −0.27 and its average at −0.24. The decline is healthy in the technical sense: lower lows, pace held.
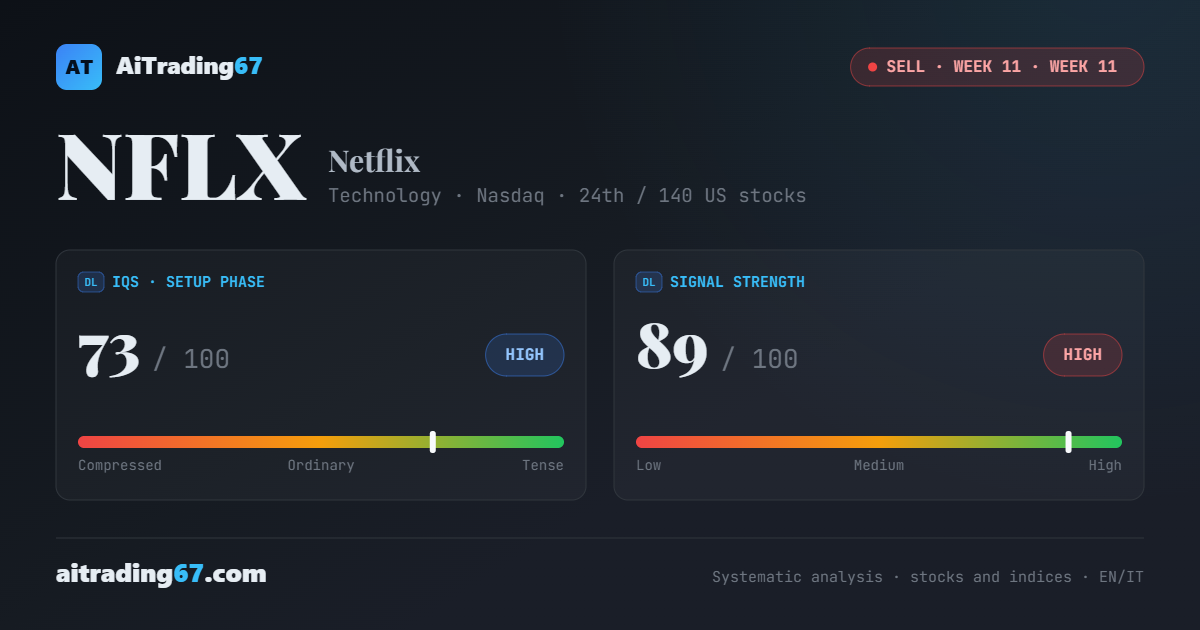
The maturity gauges. The IQS, which measures the quality and phase of the setup, is at 73 out of 100; the Signal Strength, which measures the width and conviction of the move, at 89 out of 100. High readings, and my model puts the bearish scenario at 89% with the descriptor «decline at lower lows, pace held». Careful how you read that: high conviction means a wide move, and a wide move also means high path risk. It does not mean a safe signal.
The daily agrees, and is stretched. Relative strength (RSI) at 31 on both the daily and the weekly — oversold on two horizons at once. Trend strength (ADX) at 32 on the daily, negative directional at 42.4. Price sits below its daily Bollinger band, area 69.68, and just above the weekly one, area 68.49: squeezed between the two, which is the signature of a stretched move. A technical bounce from here is normal and proves nothing.
Above, every former support has flipped. Daily Bollinger band 69.68 (−24.3% from entry) · Ichimoku Conversion Line 71.63 and the daily Inversion Point 72.10 (−21.7%) · Bollinger midline 73.88 and Ichimoku Base Line 73.91 · the 20-day average at 74.94 and the 7-session high at 75.70. The level that judges the trade is the weekly Inversion Point, area 77.98 (−15.3% from entry).
Below, almost nothing. The weekly Bollinger band at 68.49, then the floor of the no-entry zone at 66.68 and the 30-day low at 65.08 (−29.3% from entry). Beneath that there is no recent reference at all: the flip side of a stock trading at half its record — every landmark from the past sits too high to help.
AiTrading67.com
🎯
PLAN
The plan
Signal active
Short in its eleventh week, both windows already taken
SHORT — signal born around area 92.06, eleventh week, +25.1% from entry. Profit-taking windows: area 84.82 (−7.9% from entry) and area 81.72 (−11.2%), both banked weeks ago.
Stop — weekly Inversion Point, area 77.98, which sits 15.3% below the entry. On a short the stop sits above price, and at this distance the trade is not in question. Break-even at area 92.06 would give enormous room and protect almost nothing: here the Inversion Point, already well below entry, does a far better job. Trailing by steps: break-even at +4%, then +2% at +10%, then the Inversion Point as it falls.
The caution matters more than the numbers. The historical record of this signal on Netflix showed a 19.1% potential: we are at 25.1%, beyond the average maximum. With relative strength at 31 on both horizons and price outside its lower Bollinger band, the gift has already been taken. You do not chase this.
LONG — alternative, not active (service information, not a trade): it would trigger only above the weekly Inversion Point, area 77.98 — the long begins where the short dies. That is 15.3% above the entry level, so today it is theory. Reference targets area 85.85 and area 88.05, with stops at area 70.43 and 69.17.
Ideal entry — not here. Opening a short at +25.1% with the stock oversold on two timeframes means buying the move at its point of maximum extension, with the first support less than six points away and a congestion zone eleven points wide. For anyone hunting the bounce, that is a bet against the signal and should be treated as one: nothing before a close above the daily Inversion Point at 72.10, and with the real ceiling at 77.98.
AiTrading67.com

Deep-dive · Netflix stock analysis
Analysis
There is no «we told you so» here
What a chart can measure, and what it cannot

Let me be precise about what this analysis did and did not do, because the difference is the whole point. No chart could have predicted the guidance. The quarter was almost in line, the profit beat, and the decision to narrow the disclosed engagement metrics is a management choice that lives nowhere in the price data.

What the chart had been measuring since April is something else, and more useful: that money was leaving the stock week after week. Eleven weeks of an active sell signal, weekly money flow in distribution, price at half its record.

Sell signal since 27 April · 11 weeks · weekly money flow −0.27 · price 48.6% below the all-time high

The quarter was the occasion, not the cause. That distinction is what separates a trading strategy from a commentary: one tells you where you are and where you get out, the other explains yesterday after the fact.

Price action does not forecast the news. It measures who is leaving the room before the news arrives.

Conclusions
The gift has already been taken
A +25.1% short into an oversold reading on two timeframes is not an invitation to add. It is an invitation to protect.

The trailing stop does the work from here, and the weekly Inversion Point sits far enough above price that the position is under no pressure at all. That is the comfortable half of the job. The uncomfortable half is resisting the pull to press a winner at the exact moment the numbers say the average move is already spent.

Netflix stays in the book as a reminder that the best trades end quietly, with a level that rises to meet the price, rather than with a decision to be clever one more time.
For informational and educational purposes only, not personalised financial advice. Past performance does not guarantee future results. Levels are readings at the 17 July 2026 close. Ticker links point to the latest published analysis and adapt to your membership.
Share WhatsApp Telegram Gmail LinkedIn