
Sector rotation: US tech runs while Europe corrects across the board
Macro context
The underlying regime remains risk-friendly, with no blocks or brakes on positioning. Equity volatility has fallen sharply over the past month and stays contained; the bond market is calm too, and the tail-risk premium looks moderate. Breadth in the US tape keeps improving — more than half of stocks now sit above their long-term average — a detail that lends solidity to the advance, because the push is not coming from a handful of names alone.
On the commodity side the tone is duller: gold has lost ground and trades near the low of its six-month range, while crude stays weak, sharply lower over recent weeks. The dollar is barely moving, with a slight upward tilt and cooling momentum. Shipping rates hint at a modest recovery. It is a backdrop that rewards equity risk but offers no clear lift from commodities, and that asymmetry reads clearly in the rotation: the US runs on a growth leader, while Europe struggles to find an engine and corrects broadly.
US sectors
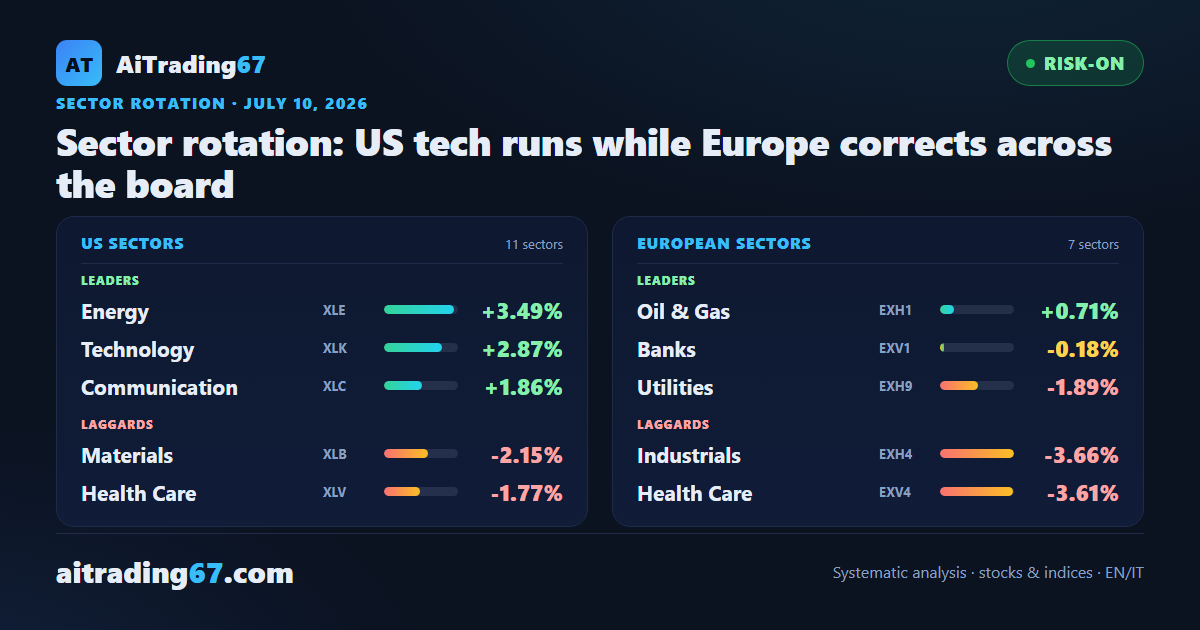
Leadership sits firmly with technology. XLK closes at +2.87% with improving relative strength and the strongest trend readings in the group: RSI at 66.7, ADX at 32.7 and a MACD histogram in positive territory. It is the only sector aligning price, momentum and structure in the same direction, which makes it the true center of gravity for the week.
Around the leader the move is more tactical than structural: energy (XLE) is the top performer, +3.49%, with recovering relative strength, yet it remains below its averages in a bearish regime — a rebound from a still-weak sector, to be read with caution. Communications (XLC) add +1.86% despite soft momentum (RSI 47.4), while financials (XLF, +0.16%) and consumer discretionary (XLY, +0.10%) stay essentially flat: they join the positive tone but with fading relative strength.
The tail is both defensive and cyclical. Materials (XLB) shed -2.15%, health care (XLV) -1.77% despite a still-high RSI at 61.2, industrials (XLI) -1.08% while keeping a robust RSI at 67.8, and consumer staples (XLP) -1.02%. These are orderly pullbacks, not breaks: most of these sectors remain in a bullish regime, with relative strength simply sliding in favor of the technology bloc. It is internal rotation, not a flight from risk.
European sectors
The European picture is almost entirely red, and the contrast with the US is the real story of the week. Holding the structure are the banks (EXV1): they close just below flat, -0.18%, yet display the strongest momentum in the area — RSI at 69.5 and ADX at 29.2 in a bullish regime. They are the pillar around which everything else turns, even when the weekly price adds no ground.
The only firmer gains belong to structurally struggling sectors: telecoms (EXV2) rise +1.08% but stay below their averages with weak momentum, and oil & gas (EXH1) adds +0.71% despite a bearish regime, in line with the energy fatigue seen across global markets.
Most of the group corrects sharply. The hardest hit are industrials (EXH4), -3.66%, and health care (EXV4), -3.61%, both still in a bullish regime but with fading relative strength — wide drops that cool two previously solid sectors. Next comes European technology (EXV3), -2.61%, which despite a still-constructive RSI at 61.9 moves opposite to its American cousin. Rounding out the list are basic resources (EXV6, -2.52%) and automobiles (EXHG, -2.11%), the latter the most fragile of the group, with RSI at 42.2 and a directionless trend. Utilities (EXH9) fall -1.89% but keep the highest ADX in the area, at 33.1: an orderly trend that gives back only a little ground.
Cross-region comparison & broad indices
The most telling snapshot is the same label with the opposite sign. Technology rises 2.87% in the US and falls 2.61% in Europe; industrials lose a point across the Atlantic and nearly four in the Old Continent; health care sheds -1.77% on Wall Street and -3.61% in Frankfurt. This is not a divergence of nuance: it is concentrated, recognizable US leadership against a broad, uniform European correction.
The implications for the broad baskets follow accordingly. The weight of technology keeps the Nasdaq and S&P 500 on track — fittingly, the US broad indices close the week higher (S&P +1.37%, Nasdaq 100 +1.81%) — while in Europe the lack of an engine drags the generalist indices, with the exception of bank-heavy markets, where the strength of the credit sector offers a cushion: this is the case for Milan, the most resilient of the area in terms of signal quality.
The operational read is clear: as long as contained volatility and improving breadth hold the backdrop, strength lies where there is a real leader — today, US technology — while Europe waits for a sector able to take the baton, with banks the only reliable reference. Internal rotation in the US, a broad correction in Europe: two markets, two speeds.