
EN IT

Apple stock analysis: an all-time high on the day spending became a sin

Apple stock analysis: Taiwan Semiconductor raised 2026 capex and the market sold the whole AI chain. Apple, handed its AI by a partner, printed an all-time high the same day. Why my model rates it highly and still refuses to buy it.

Apple stock analysis: an all-time high on the day spending became a sin
Stay updated
Don't miss the next World Observatory
Get an email with every new World Observatory. Free, unsubscribe in one click.
World Observatory updates only.
Done! Check your inbox to confirm your subscription.
Something went wrong. Please try again shortly.
Want World Observatory by email too?
You're already with us: add World Observatory to your emails from your preferences.
Manage your emails →
Apple Stock Analysis · AI Capex Rotation
Apple stock analysis: an all-time high on the day spending became a sin
July 17, 2026 — Fabio Gentili observatorytrading
The session
Apple stock analysis after a session worth keeping. Yesterday the entire artificial-intelligence chain collapsed — Marvell −8.7%, ARM −7.3%, Oracle −6.2% — and Apple closed up 1.76% on a new all-time high. The two facts share one cause: the market stopped paying those who build AI and started paying the one who is handed it. Below: what happened, the levels that matter and the swing trading plan.
AiTrading67.com

What happened
🇺🇸
SESSION
The day spending became a sin
High tension
Good news, read backwards
Taiwan Semiconductor beat earnings expectations, then raised 2026 capital spending to $60-64bn from $52-56bn. For years that would have read as confidence in demand; yesterday the market read it as overspending and sold everything that funds it: Marvell −8.7%, ARM −7.3%, Oracle −6.2%, Intel −5.8%, Micron −5.7%, Broadcom −3.4%. Netflix then dropped 8-9.7% after hours on its results.
Apple went the other way, to a record: Alibaba's Qwen model will power Apple Intelligence on iPhones in China. No data centres, no capital spending — in the session where capex became a sin, the one large name without it ended on top.
Sector maths, for context: technology (XLK) was the worst performer at −2.2% and −4.8% on the month, while staples, healthcare and real estate took the top three slots.
AiTrading67.com
📊
TECHNICALS
Apple stock analysis: structure and levels
Structure intact
Apple technical analysis: the chart, read in full
The weekly has no cracks. Moving averages at 20, 50, 100 and 200 periods all well below price, price above the Ichimoku cloud, relative strength (RSI) at 69, moving average convergence (MACD) positive and accelerating. Trend strength (ADX) at 23 with directionals at 39 against 16. Chaikin money flow at +0.14 with the raw reading above its average: accumulation still building. Buyers took 94% of the week's volume. Volatility (ATR) around 4.9%.
The daily concurs. Relative strength at 71 — overbought, not extreme — convergence accelerating, money flow at +0.13 against a +0.02 average, buying volume at 82%. A strong double bottom sits behind it.
Above price, almost nothing. Three levels crowd within half a point: daily Bollinger band 334.00, all-time high 334.68, weekly Bollinger band 335.01. Above them: ground never covered.
Below, the cushions. Daily VWAP 331.58, then the daily Inversion Point at 321.34 and the Ichimoku Conversion Line at 320.84; further down the 20-day average at 309.31 and the 7-session low at 307.05. The level that judges the trade is the weekly Inversion Point, 303.53; below it, the 50-day average at 299.04.
AiTrading67.com
🎯
PLAN
The plan
Signal active
Long in its second week, targets all ahead
LONG — signal born on 6 July around area 317, second week (the confirmation one). Profit-taking windows: area 363 (+14.6% from entry, by week 6) · area 378 (+19.4%, by week 8) · area 394 (+24.3%, by week 10). None touched yet.
Stop — weekly Inversion Point, area 303.53, which still sits 4.2% BELOW the entry: two weeks in, the trailing has not dragged anything to safety yet. Break-even at area 317 is therefore the TIGHTER option here, not the roomier one. Trailing by steps: break-even at +4%, then +2% at +10%, then the Inversion Point as it climbs.
SHORT — alternative, not active (service information, not a trade): it would trigger only below the weekly Inversion Point, area 304 — the short begins where the long dies. The box in the last published analysis is anchored to area 291, a level the Inversion Point has since passed: treat those targets as an order of magnitude, not a plan.
Ideal entry — not here: price is leaning on its Bollinger band on both timeframes, the day after the record. The area that would make sense is the daily Inversion Point, 321. No-entry zone: 314.80 – 316.91, now a cushion below price.
AiTrading67.com

Deep-dive · Apple stock analysis
Analysis
The strongest name in the basket, and my model rejects it
Why «how good is the stock» and «where would it put you in» are two different questions

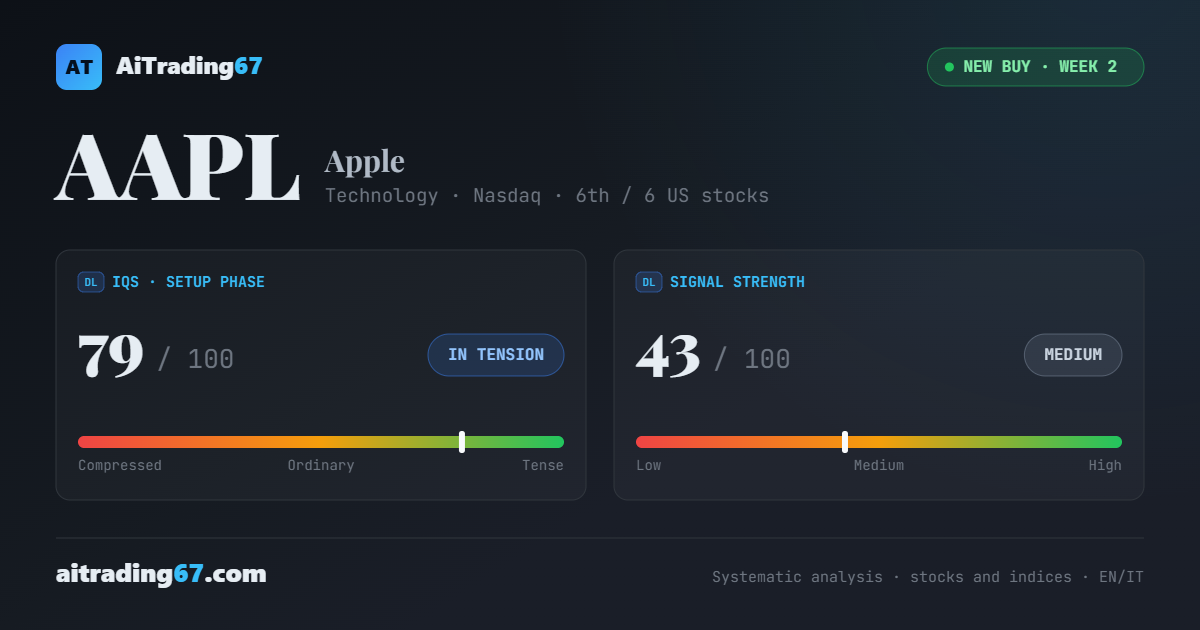
My model says two things that look contradictory. The quality and phase of Apple's setup sit at 79 out of 100: high. Weekly price action is at its strongest bullish grade. And yet the stock is graded low quality and ranks last in its category.

That is not a bug. What rejects it is not the verdict on the stock but the Entry Protocol, which answers a different question: not «how strong is it» but «where would it put you in». The signal was born on 6 July around 317 and the stock has climbed without pause since, straight into the bottleneck of the three levels.

Three levels within half a percentage point: daily Bollinger band 334.00 · all-time high 334.68 · weekly Bollinger band 335.01.

In plain terms: the stock is excellent and the moment to buy it is poor. Two sentences that can share a line without fighting. Merge them into one — «it's strong, so I'm buying» — and you are buying someone else's excitement on the day of the record.

This is exactly what a model is for: keeping apart the questions that emotion tends to merge.

Conclusions
Who builds it, who uses it
Yesterday the market punished those who build artificial intelligence and rewarded the one who uses it. Twelve months ago that distinction did not exist.

I keep Apple as a reminder of method rather than a trade idea. The strongest name in the basket is also the one my Entry Protocol rejects today, and that is exactly right: strength is measured on the chart, risk is measured at the point where you step in.

That is why a trading strategy worth the name does not end with a verdict on the stock: it ends with a level. Price action trading is the discipline of keeping count of those levels when excitement suggests ignoring them.
For informational and educational purposes only, not personalised financial advice. Past performance does not guarantee future results. Levels are readings at the 16 July 2026 close. Ticker links point to the latest published analysis and adapt to your membership.
Share WhatsApp Telegram Gmail LinkedIn