
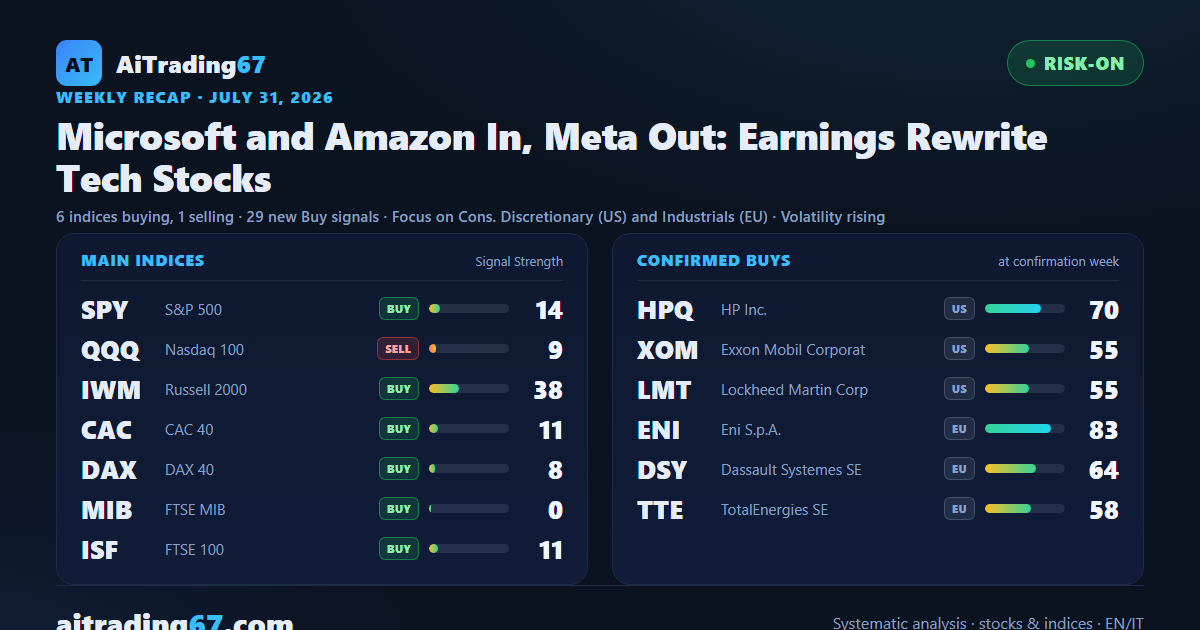
Weekly recap · 27-31 July 2026
Microsoft and Amazon In, Meta Out: Earnings Rewrite Tech Stocks
6 indices buying, 1 selling · 29 new Buy signals · Focus on Cons. Discretionary (US) and Industrials (EU) · Volatility rising
01
The week in view
The week opened with two fears and no referee: oil rekindling inflation, and the cost of artificial intelligence failing to come back as revenue. On Wednesday the Federal Reserve held rates for the fifth consecutive meeting. Then earnings arrived, and split technology in two.
The result is the sharpest reversal we have seen in months. Microsoft gained 21.8% and Amazon 17.0% on the week, and both now carry a fresh buy signal: the market rewarded those who showed that AI spending comes back as revenue. Meta lost 6.5% and has flipped to a sell signal, punished for how much it invests rather than rewarded for how much it grows. Apple shed 7.2% inside a buy position opened four weeks ago, now two points underwater. Alphabet and Nvidia have been on sell signals for seven weeks. Three positions flipped in five sessions, on the very names that carry the most index weight: that is why the Nasdaq erased six days of losses in a single session and why US technology gained 5.5% on Friday, coming off a month down nearly 8%. This is not a healthy sector accelerating, it is a beaten-down sector bouncing — and one that has just changed its leaders.
What nobody resolved sits in fixed income. Volatility on US Treasuries has risen for four straight weeks and is up almost 20%: no other gauge we track holds a direction that persistently. Equities threw a party; bonds did not show up. Until that tension turns, every equity rally stands on one leg.
Two things explain why that rebound does not settle the matter. The first is the Federal Reserve meeting: rates stayed put, but three members voted to raise them and the US 30-year went to its highest since 2007. This is not an accommodative central bank buying time, it is a divided one — and that is where the rate tension running through the week comes from, from utilities at the bottom to every credit-sensitive name.
The second is oil, which swung further than anything else: down over 7% in two sessions on the US-Iran truce — the worst three-day stretch in six years — then back up after the Korean chip rout. That swing decided half the European market, and it is why Eni clears its confirmation week on the strongest conviction of the group.
The thread tying it together is rotation: money did not leave the market, it changed vehicle. From silicon to software, from defensives to banks. You can see it in the gap between the two US indices, which widened during the week: the S&P 500 holds up because half its weight sits outside technology; the Nasdaq does not.
Every company that reported this week. 52 of the names we track published results between 27 and 31 July, which is why the week moved so much. Below is the full list with the weekly change: each name links to its own note, where you will find the full technical read and the operating levels.
A2A S.p.A. (A2A) -3.6% · AbbVie, Inc. (ABBV) -3.2% · Adidas AG (DLY_ADS) -8.2% · AES Corporation (AES) -1.1% · Amazon.com, Inc. (AMZN) +17.0% · American Water Works Company, Inc. (AWK) -0.4% · Anglo American plc (DLY_AAL) +0.3% · Apple Inc. (AAPL) -7.2% · AXA SA (CS) +0.2% · Azimut Holding Spa (AZM) +5.1% · BAE Systems plc (DLY_BA.) +6.2% · Bristol-Myers Squibb Company (BMY) +5.2% · Capgemini SE (CAP) +14.0% · Chevron Corporation (CVX) +1.0% · Compagnie de Saint-Gobain SA (SGO) +9.6% · Danone SA (BN) -3.5% · Davide Campari-Milano N.V. (CPR) +5.9% · DiaSorin S.p.A. (DIA) +7.7% · Edison International (EIX) -8.0% · Eni S.p.A. (ENI) +4.4% · Exxon Mobil Corporation (XOM) -1.0% · Ferrari NV (RACE) +6.9% · Fincantieri S.p.A. (FCT) +6.1% · Fortis Inc. (FTS) -3.1% · GSK plc (DLY_GSK) +0.6% · Hera S.p.A. (HER) -3.4% · L'Oreal S.A. (OR) +3.3% · Leonardo SpA (LDO) +5.5% · London Stock Exchange Group plc (DLY_LSEG) -4.3% · Mastercard Incorporated Class A (MA) +6.2% · Meta Platforms Inc Class A (META) -6.5% · Microsoft Corporation (MSFT) +21.8% · Moderna, Inc. (MRNA) +1.4% · Nebius Group N.V. Class A (NBIS) +1.4% · Nexi S.p.A. (NEXI) +7.2% · Norwegian Cruise Line Holdings Ltd. (NCLH) -4.3% · Procter & Gamble Company (PG) -2.0% · Prysmian S.p.A. (PRY) -5.3% · Pulmonx Corp. (LUNG) +39.3% · Reddit, Inc. Class A (RDDT) -16.6% · Regeneron Pharmaceuticals, Inc. (REGN) +16.3% · Riot Platforms, Inc. (RIOT) -10.5% · Rivian Automotive, Inc. Class A (RIVN) -3.9% · Robinhood Markets, Inc. Class A (HOOD) -8.8% · Roblox Corp. Class A (RBLX) -25.1% · Shell plc (DLY_SHEL) +2.4% · Siemens Healthineers AG (DLY_SHL) +5.1% · SoFi Technologies Inc (SOFI) -0.9% · Starbucks Corporation (SBUX) +1.9% · Telecom Italia S.p.A. (TIT) +0.3% · uniQure N.V. (QURE) +12.0% · VINCI SA (DG) +3.5%.
The result is the sharpest reversal we have seen in months. Microsoft gained 21.8% and Amazon 17.0% on the week, and both now carry a fresh buy signal: the market rewarded those who showed that AI spending comes back as revenue. Meta lost 6.5% and has flipped to a sell signal, punished for how much it invests rather than rewarded for how much it grows. Apple shed 7.2% inside a buy position opened four weeks ago, now two points underwater. Alphabet and Nvidia have been on sell signals for seven weeks. Three positions flipped in five sessions, on the very names that carry the most index weight: that is why the Nasdaq erased six days of losses in a single session and why US technology gained 5.5% on Friday, coming off a month down nearly 8%. This is not a healthy sector accelerating, it is a beaten-down sector bouncing — and one that has just changed its leaders.
What nobody resolved sits in fixed income. Volatility on US Treasuries has risen for four straight weeks and is up almost 20%: no other gauge we track holds a direction that persistently. Equities threw a party; bonds did not show up. Until that tension turns, every equity rally stands on one leg.
Two things explain why that rebound does not settle the matter. The first is the Federal Reserve meeting: rates stayed put, but three members voted to raise them and the US 30-year went to its highest since 2007. This is not an accommodative central bank buying time, it is a divided one — and that is where the rate tension running through the week comes from, from utilities at the bottom to every credit-sensitive name.
The second is oil, which swung further than anything else: down over 7% in two sessions on the US-Iran truce — the worst three-day stretch in six years — then back up after the Korean chip rout. That swing decided half the European market, and it is why Eni clears its confirmation week on the strongest conviction of the group.
The thread tying it together is rotation: money did not leave the market, it changed vehicle. From silicon to software, from defensives to banks. You can see it in the gap between the two US indices, which widened during the week: the S&P 500 holds up because half its weight sits outside technology; the Nasdaq does not.
Every company that reported this week. 52 of the names we track published results between 27 and 31 July, which is why the week moved so much. Below is the full list with the weekly change: each name links to its own note, where you will find the full technical read and the operating levels.
A2A S.p.A. (A2A) -3.6% · AbbVie, Inc. (ABBV) -3.2% · Adidas AG (DLY_ADS) -8.2% · AES Corporation (AES) -1.1% · Amazon.com, Inc. (AMZN) +17.0% · American Water Works Company, Inc. (AWK) -0.4% · Anglo American plc (DLY_AAL) +0.3% · Apple Inc. (AAPL) -7.2% · AXA SA (CS) +0.2% · Azimut Holding Spa (AZM) +5.1% · BAE Systems plc (DLY_BA.) +6.2% · Bristol-Myers Squibb Company (BMY) +5.2% · Capgemini SE (CAP) +14.0% · Chevron Corporation (CVX) +1.0% · Compagnie de Saint-Gobain SA (SGO) +9.6% · Danone SA (BN) -3.5% · Davide Campari-Milano N.V. (CPR) +5.9% · DiaSorin S.p.A. (DIA) +7.7% · Edison International (EIX) -8.0% · Eni S.p.A. (ENI) +4.4% · Exxon Mobil Corporation (XOM) -1.0% · Ferrari NV (RACE) +6.9% · Fincantieri S.p.A. (FCT) +6.1% · Fortis Inc. (FTS) -3.1% · GSK plc (DLY_GSK) +0.6% · Hera S.p.A. (HER) -3.4% · L'Oreal S.A. (OR) +3.3% · Leonardo SpA (LDO) +5.5% · London Stock Exchange Group plc (DLY_LSEG) -4.3% · Mastercard Incorporated Class A (MA) +6.2% · Meta Platforms Inc Class A (META) -6.5% · Microsoft Corporation (MSFT) +21.8% · Moderna, Inc. (MRNA) +1.4% · Nebius Group N.V. Class A (NBIS) +1.4% · Nexi S.p.A. (NEXI) +7.2% · Norwegian Cruise Line Holdings Ltd. (NCLH) -4.3% · Procter & Gamble Company (PG) -2.0% · Prysmian S.p.A. (PRY) -5.3% · Pulmonx Corp. (LUNG) +39.3% · Reddit, Inc. Class A (RDDT) -16.6% · Regeneron Pharmaceuticals, Inc. (REGN) +16.3% · Riot Platforms, Inc. (RIOT) -10.5% · Rivian Automotive, Inc. Class A (RIVN) -3.9% · Robinhood Markets, Inc. Class A (HOOD) -8.8% · Roblox Corp. Class A (RBLX) -25.1% · Shell plc (DLY_SHEL) +2.4% · Siemens Healthineers AG (DLY_SHL) +5.1% · SoFi Technologies Inc (SOFI) -0.9% · Starbucks Corporation (SBUX) +1.9% · Telecom Italia S.p.A. (TIT) +0.3% · uniQure N.V. (QURE) +12.0% · VINCI SA (DG) +3.5%.
02
Macro regime
market contextRisk-On
The macro picture stays broadly supportive, with equity volatility easing and market breadth improving, yet rate tension has been building for a month and remains the one front that has not turned.
VIX
Neutral
MOVE
Favorable
DXY
Neutral
Breadth
Neutral
03
Main indices
7 Broad ETFsSix of seven indices remain on a buy signal, and the top of the table is European: Milan leads with over 12% since the signal, followed by US small caps above 11%. The exception is the Nasdaq, the only one now on a sell signal, closing the week still 8% below its highs. Worth noting what Signal Strength says: it is low almost everywhere, even where gains are in double digits. These are trends running for sixteen weeks that have lost momentum along the way — the structure holds, the acceleration does not. The gap between the two US indices remains the most honest thermometer of this phase, and we tracked it every day in our Observatory notes, from the opening of the week to Friday’s close.
State Street SPDR S&P 500 ETF (SPY)Buy · open›
The S&P 500 buy signal has run sixteen weeks and is worth nearly 10%, with price back within two points of its record. But the weekly MACD histogram has crossed below zero and the trend is losing direction: the structure holds, the push has been spent. Our model's third trim window falls next week.
Signal Strength14 / 100
Invesco QQQ Trust Series I (QQQ)Sell›
The only one of the seven now on a sell signal — and confirmation has not arrived: since the signal the Nasdaq is up 0.5%, moving away from the threshold that would validate the downside. It sits 8% below its highs, with three lower highs on the daily chart and weekly momentum still below zero. A signal switched on that the market has yet to endorse.
Signal Strength9 / 100
iShares Russell 2000 ETF (IWM)Buy · open›
US small caps are the second-best open trade in the group, above 11% over sixteen weeks. This week the MACD histogram completed its move below zero with a bearish crossover, and the daily chart shows four lower highs. It is the most evenly spread basket of the seven: no single sector carries it, which makes it sensitive to rates rather than to individual stories.
Signal Strength38 / 100
Multi Units France Sicav (CAC)Buy · open›
Paris is back within a whisker of its all-time high, less than 1% away against 2.3% seven days ago, and the MACD histogram has turned up after three weeks of retreat. The counterweight sits in volume: daily buy participation fell sharply just as price attacked the record. Industrials and banks, the basket's two largest weights, both gained over 2%.
Signal Strength11 / 100
Amundi DAX II UCITS ETF Acc (DAX)Buy · open›
Frankfurt has recovered from its lows and is back around one point from its record after three rejected attempts, with weekly momentum turning up again. The signal has run fifteen weeks and is worth 3.4%: the smallest gain among the Europeans. Conviction as our model measures it stays low, so this is a picture to hold rather than to add to.
Signal Strength8 / 100
Amundi FTSE MIB UCITS ETF (MIB)Buy · open›
Milan leads the group with over 12% since the signal, but the week left a clear mark: on 27 July price attacked the all-time high and was firmly rejected. Trend directionality is rising while weekly momentum has fallen for four weeks — a divergence all its own. Banks account for nearly half the basket and pulled their weight this week. The banks are running inside a wave of bids and board meetings we covered <a href="https://aitrading67.com/tag/report_giornaliero/" style="color:#ffffff;text-decoration:underline;text-underline-offset:2px">at the start of the week</a>.
Signal Strength0 / 100
iShares Core FTSE 100 UCITS ETF (ISF)Buy · open›
London brings the cleanest technical news of the seven: the weekly MACD histogram has risen for four straight readings and is back above zero with a bullish crossover, on one of the most directional trends in the group. Yet the gain since the signal is the thinnest, below 2%, with more than 8% of room still to the record. Daily buy participation, though, has thinned out.
Signal Strength11 / 100
04
Sector rotation
US · EuropeIn the United States consumer discretionary left everyone behind with over 6% on the week, but on a still-weak trend reading: this is a move starting out, not one maturing. At the bottom, utilities down more than 4%, alongside real estate and materials — the three groups that suffer when rates rise, punished in the same week on both sides of the Atlantic. Europe shows a tidier picture: industrials, banks and basic resources climb together on the day, the week and the month, and European banks are the one place where all three horizons tell the same story. The full picture across the 20 sector ETFs — US and Europe, group by group — is in the dedicated sector rotation note.
US sectors
XLY›
State Street Consumer Discreti
rising · +6.11%
XLC›
State Street Communication Ser
rising · +1.83%
XLF›
State Street Financial Select
rising · +1.12%
XLP›
State Street Consumer Staples
rising · +1.09%
XLV›
State Street Health Care Selec
flat · -0.01%
XLE›
State Street Energy Select Sec
flat · -0.12%
XLB›
State Street Materials Select
falling · -1.62%
XLRE›
State Street Real Estate Selec
falling · -1.92%
XLU›
State Street Utilities Select
falling · -4.19%
European sectors
EXH4›
iShares STOXX Europe 600 Indus
rising · +2.11%
EXV1›
iShares STOXX Europe 600 Banks
rising · +2.05%
EXV6›
iShares STOXX Europe 600 Basic
rising · +1.71%
EXH1›
iShares STOXX Europe 600 Oil &
flat · +0.11%
EXV3›
iShares STOXX Europe 600 Techn
flat · -0.23%
EXV4›
iShares STOXX Europe 600 Healt
falling · -0.61%
EXH9›
iShares STOXX Europe 600 Utili
falling · -3.06%
05
Confirmed Buy signals
at the confirmation weekNine names cleared the confirmation week: four American, five across Europe and the UK. For our method this step matters more than the initial signal — a signal that survives its first test rests on firmer ground than one that contradicts itself immediately. The common thread is clear: energy and heavy industry, with Eni arriving on the strongest conviction of the group, followed by the French design software group and TotalEnergies. On the US side, defence and industrials — Lockheed Martin and Honeywell — alongside Exxon and personal computing. This is the side of the market built on order books and cash coming in today, the opposite of what the rate repricing is punishing. It pays to read the individual notes before deciding: confirmation says the signal held, not that the timing suits everyone.
1
HPQ
HP Inc.
Strength 70
›
2
XOM
Exxon Mobil Corporation
Strength 55
›
3
LMT
Lockheed Martin Corporation
Strength 55
›
4
HON
Honeywell International Inc.
Strength 47
›
1
ENI
Eni S.p.A.
Strength 83
›
2
DSY
Dassault Systemes SE
Strength 64
›
3
TTE
TotalEnergies SE
Strength 58
›
4
EXPN
Experian plc
Strength 56
›
5
EXH1
iShares STOXX Europe 600 Oil & Gas UCITS ETF
Strength 44
›
None this week
06
Ranker rankings
Top by Signal StrengthSixteen fresh buy signals across US stocks, and the first thing to flag is quality: three of the top five arrive in the band our protocol marks as skip, despite the signal being live. The strongest conviction sits on AMC and Pulmonx, both around 84 out of 100, followed by Ford and Salesforce at 72. It is an unusual mix — entertainment, medical devices, legacy autos and enterprise software: no single sector thesis, which in itself describes a market hunting for direction rather than following one. Take the time to read the individual notes before acting: high Strength measures the breadth of a move, not its safety, and where the move is wider the path is bumpier. Size positions accordingly.
One hundred and twenty US positions remain open, and the top five share a trait that matters more than the ranking: all are high-conviction tech stocks and digital services, between 86 and 87 out of 100. Fortinet, PayPal, Snowflake, Oscar Health and Datadog represent precisely the side of the market that the rate repricing punished over the past fortnight and that Thursday night's rebound partly rehabilitated. That is the tension to watch: these trades are working, with momentum intact, yet they belong to the group most exposed should fixed-income pressure resume. Those already in can stay with the position; for anyone watching from outside, the individual notes say more than the ranking position.
One hundred and thirty-eight US stocks remain on sell signals, and the top of the list is filled with maximum-conviction names: Blaize, Roblox and Reddit all reach 100 out of 100, followed by Meta at 92 and Robinhood at 79. All five, however, carry the band that advises against acting — a combination worth explaining: conviction that high measures how wide and coherent the move is, not how prudent it is to chase now. These are declines already under way, often on high-volatility names, where the risk of arriving late is real. The useful reading is contextual rather than operational: they show where the market is withdrawing capital, and this week it is withdrawing from speculative stocks and social media.
Twelve new signals across European stocks and the UK, and the reading here is cleaner than on the US side. Capgemini and Kering lead at 75 out of 100, followed by BAE Systems, SAP and Leonardo at 63. Defence and aerospace appear twice in the top five, confirming a theme our model has tracked for weeks: these are companies with long-term orders already on the books, precisely the kind of visibility the market is rewarding while it punishes those promising future revenue. All five arrive in band C, meaning a cautious opening: the signal is valid, the size should be contained. Kering's luxury exposure is the group's outlier and deserves its own read.
Sixty-one European and UK stocks in open positions, with a distinctly Italian top end: Eni, FinecoBank and Fincantieri all reach 83 out of 100, alongside Brunello Cucinelli, while Bayer leads at 89. It is the portrait of a healthy domestic market, which our index ranking confirms from the Milan side. Eni deserves particular attention because it also cleared the confirmation week, with half-year results now behind it: two independent checks saying the same thing. Italian bank stocks remain the group where daily, weekly and monthly horizons tell one consistent story — and in this phase that consistency is anything but routine.
Forty-seven European stocks on sell signals, led by Adidas at maximum conviction and Lottomatica at 82. Then comes QDVE, the Nasdaq ETF listed in Europe, Italgas and Hermès. The composition says something specific: consumer discretionary, gaming and luxury take three of the five slots, and these are the sectors that pay first when purchasing power contracts. All five carry the band advising against action, so the reading is contextual: they show where pressure is concentrating, not an invitation to act. Hermès in particular is in its second week, and its individual note is worth reading, because the technical picture is less clear-cut than the ranking position suggests.
A single stock with a new buy signal in the rest of the world this week: Banco do Brasil, on medium conviction with band C calling for a cautious opening. A list this short is information in itself — in a week when the United States and Europe produced twenty-eight new signals, emerging markets offered one. Keep in mind that Friday's weaker dollar historically works in these markets' favour: should that softness consolidate, it is reasonable to expect the list to lengthen in coming weeks. For now it remains a single signal, to be read on its own note before any portfolio consideration.
Twelve Brazilian stocks in open positions and all concentrated on two themes: energy and credit. Light leads at 86 out of 100, followed by Ultrapar at 70, then Cosan, Petrobras and Bradesco. It is the same thesis working in developed markets — companies earning cash today rather than promising it — applied to a market where the commodity cycle carries more weight than elsewhere. The link to oil is direct and worth keeping in mind: crude remains over 20% higher on the month, but its climb stems from geopolitical rather than economic reasons, which leaves the group more exposed to headlines than to fundamentals. The individual notes tell this better than the ranking.
Eighteen stocks on sell signals outside the United States and Europe, with Gafisa leading at 81 out of 100 and Oi at 67, followed by two steelmakers and Qualicorp. Construction, telecoms and steel: these are the Brazilian groups most sensitive to the cost of money, and finding them clustered on this list fits the rate tension running through the entire week, from the United States to Brazil. All carry the band advising against action. The reading matches the other sell blocks: they help you see where capital is retreating, and here it is retreating from sectors that depend on credit.
1
GFSA3
Gafisa S.A.
Strength 81
›
2
OIBR4
Oi S.A.Non-Cum Perp Pfd Registered Shs
Strength 67
›
3
USIM5
Usinas Siderurgicas de Minas Gerais SA-Usiminas Pfd A
Strength 60
›
4
CSNA3
Companhia Siderurgica Nacional
Strength 47
›
5
QUAL3
Qualicorp Consultoria e Corretora de Seguros S.A.
Strength 37
›
See all 18 →
Methodology note — Nothing written here constitutes financial advice, a solicitation to buy or sell financial instruments, or any kind of recommendation. Past performance is not indicative of future results. Trading involves significant risk of loss; the user acts under their own responsibility. Signal Strength is an internal analytical framework used only to rank relative technical quality within the basket. © Fabio Gentili.