
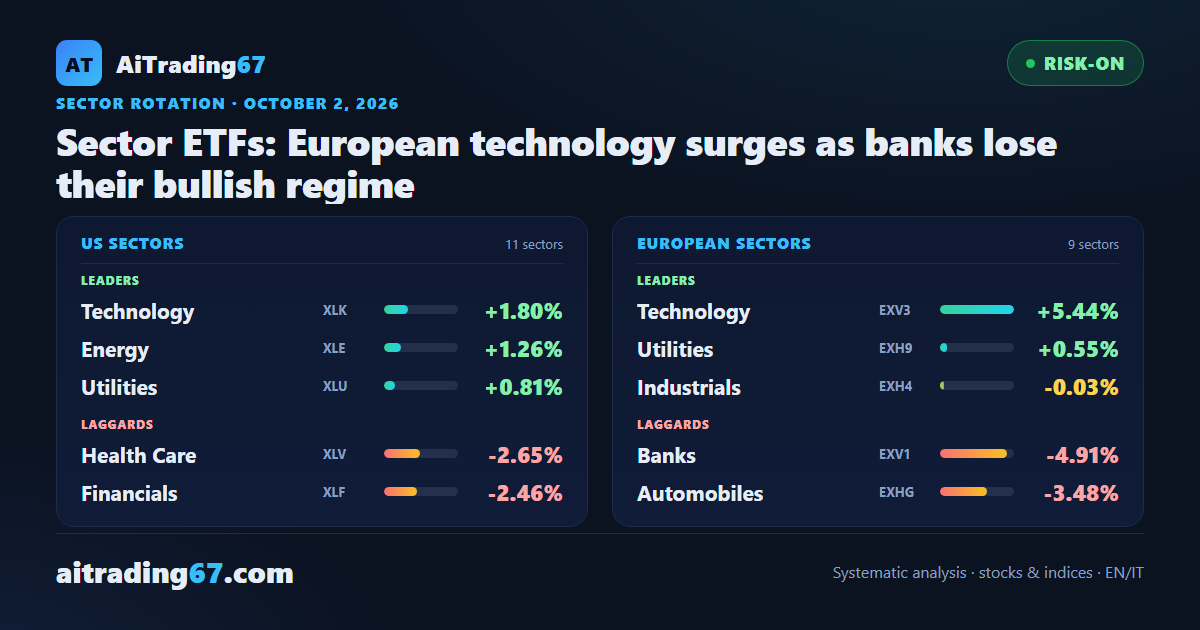
Sector ETFs: European technology surges as banks lose their bullish regime
Macro context
The macro backdrop has become less comfortable. Expected volatility on US equities moves from favorable territory into the attention zone, up 5.37% over 4 weeks, and Treasury volatility keeps accelerating: +46.77% on the month, against 35.27% a week ago, and now in the attention zone as well. The cost of protection against extreme declines stays in favorable territory and falls 4.42%: the market is more nervous, with no sign of a rush to hedge.
The sticking point is still US market breadth, the share of stocks actually taking part in the move: in critical territory, it is 38.61% lower than a month ago. With a base this thin, the indices depend on a handful of very heavy names.
The dollar is up 2.78% on the month and has moved to the very top of its six-month range, while gold is down 6.44% and stays in critical territory, near the bottom of the same range. Oil is flat, -0.40% on the month after +9.05% a week ago, and dry bulk freight rates are down 13.23%, in critical territory. The sectors show it at once: technology rises on its own, almost everything else retreats.
US sectors
On the US board 3 of 11 sectors rose and the simple average closed at -0.90%, against -0.54% seven days ago.
Technology (+1.80%) leads for a second week and adds the missing piece: the MACD histogram is back above zero, from -0.29 to +0.13. Bullish regime, rising relative strength, ADX at 22.5 and RSI at 69.2, one step from overbought: it is the most complete structure on the board, with little room before excess. Energy comes second (+1.26%), recovering after last week's -3.53%: it keeps its bullish regime and the highest ADX in America, at 31.7, and relative strength is rising again, while the histogram, still positive, has shrunk by 44%. Utilities are third (+0.81%), after finishing last in the two previous weeks: a bounce inside a bearish regime, with RSI at 32.7, the lowest in the basket.
The heavy news sits at the bottom of the table. Health care, third seven days ago, is last at -2.65%: the bullish regime holds, but the MACD histogram lost almost three quarters of its value in a week and relative strength has turned down. Financials (-2.46%) confirm last week's turn: a second week in a bearish regime, a negative histogram that nearly tripled, RSI at 43.1. Communication services (-2.34%) give back the bullish regime gained seven days ago, with ADX at 12.0, the lowest in America: a move with no direction behind it, which price reversed at once.
Materials (-1.89%), consumer staples (-1.86%) and real estate (-1.80%) remain in bearish regimes with falling relative strength and RSI between 34.8 and 41.3. Industrials (-0.28%) and consumer discretionary (-0.47%) limit the damage without changing structure. The final count: bullish regimes drop from 4 to 3 of 11.
European sectors
In Europe 2 of 9 sectors rose and the average stopped at -0.80%. That average hides a 10.35-point gap between first and last, more than twice the 4.85 of seven days ago.
Technology (+5.44%) posts the widest move of all 20 sectors surveyed and leads for a second week. Bullish regime, rising relative strength and RSI at 64.8, the highest in Europe; the MACD histogram is still below zero, but in seven days its negative value has shrunk by more than half. ADX remains light at 16.8: price is running, directional strength still has to build. Utilities come second (+0.55%), the only other gain: bearish regime, relative strength rising again and a histogram slowly improving, with ADX at 25.2.
At the other end are banks, last at -4.91%. A week ago they were the continent's most directional trend; now they lose their bullish regime, RSI drops from 63.1 to 52.1 and the MACD histogram, already negative, nearly triples. ADX at 31.5 is still the highest in Europe: a week ago it went with the advance, today it goes with the decline.
Basic resources (-0.36%) change regime too, turning bearish with a histogram that keeps getting more negative. Automobiles (-3.48%) stay near the bottom: the MACD histogram has just slipped below zero, RSI is at 36.7, the lowest in Europe, and ADX at 12.1. Health care (-2.52%) falls back after two positive weeks, with a bearish regime and ADX at 12.7.
Oil and gas (-1.00%) and industrials (-0.03%) hold their structure, both in bullish regimes. The former still has the only European histogram above zero, now down to a third of its value seven days ago, with RSI at 60.1; the latter are standing still, with ADX at 15.5 and RSI at 51.8. Telecoms (-0.85%) remain in a bearish regime. Bullish regimes thus drop from 5 to 3 of 9.
Cross-region comparison & broad indices
The comparison between the two sides gives a clear result: technology leads on both for a second week, and it is the only sector where price, regime and relative strength point the same way on Wall Street and in Europe alike. The difference lies in maturity. In the United States the MACD histogram is already back in positive territory and RSI is brushing overbought; in Europe price made the bigger jump and momentum is still catching up.
The second point concerns credit. US financials lost their bullish regime a week ago, European banks follow now, with a drop twice as large. On energy the two regions part ways again, with roles reversed: the US sector rises (+1.26%), European oil and gas falls (-1.00%), and the bullish regime is intact in both.
Overall, bullish regimes drop from 9 to 6 of 20, while sectors with rising relative strength go from 3 to 5: technology, energy and utilities in America, technology and utilities in Europe.
On the broad baskets the reading is consistent. The Nasdaq 100 ETF gains 0.68% and the S&P 500 ETF slips 0.22%, against a US sector average of -0.90%: the weight of technology keeps the indices afloat while 8 of 11 sectors fall, and the Nasdaq 100, the most technology-heavy of the two, is the only one in positive territory. In Europe the arithmetic is less kind: banks weigh heavily in Milan, automobiles in Frankfurt, health care in London, and those three sectors fill the last three places in the table. The 4 European indices we follow and US small caps are on a weekly Sell Signal.
For anyone trading sector ETFs, or picking stocks from the sector down, our reading suggests caution on the sectors that have just changed regime and attention to those where price and momentum move together: technology today and, in America, energy. Three checks for next week: whether US technology moves into overbought or slows, whether European banks find a footing after the regime change, whether the bounce in utilities changes the structure or stays a one-off.